Electronic Arts 2004 Annual Report Download - page 73
Download and view the complete annual report
Please find page 73 of the 2004 Electronic Arts annual report below. You can navigate through the pages in the report by either clicking on the pages listed below, or by using the keyword search tool below to find specific information within the annual report.-
 1
1 -
2
-
3
-
4
-
5
-
6
-
7
-
8
-
9
-
10
-
11
-
12
-
13
-
14
-
15
-
16
-
17
-
18
-
19
-
20
-
21
-
22
-
23
-
24
-
25
-
26
-
27
-
28
-
29
-
30
-
31
-
32
-
33
-
34
-
35
-
36
-
37
-
38
-
39
-
40
-
41
-
42
-
43
-
44
-
45
-
46
-
47
-
48
-
49
-
50
-
51
-
52
-
53
-
54
-
55
-
56
-
57
-
58
-
59
-
60
-
61
-
62
-
 63
63 -
 64
64 -
 65
65 -
 66
66 -
 67
67 -
 68
68 -
 69
69 -
 70
70 -
 71
71 -
 72
72 -
 73
73 -
 74
74 -
 75
75 -
 76
76 -
 77
77 -
 78
78 -
 79
79 -
 80
80 -
 81
81 -
 82
82 -
 83
83 -
84
-
85
-
86
-
87
-
88
-
89
-
90
-
91
-
92
-
93
-
94
-
95
-
96
-
97
-
98
-
99
-
100
-
101
-
102
-
103
-
104
-
105
-
106
-
107
-
108
-
109
-
110
-
111
-
112
-
113
-
114
-
115
-
116
-
117
-
118
-
119
 |
 |

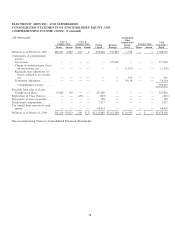
ELECTRONIC ARTS INC. AND SUBSIDIARIES
CONSOLIDATED STATEMENTS OF STOCKHOLDERS' EQUITY AND
COMPREHENSIVE INCOME (LOSS) (Continued)
(In thousands)
Accumulated
Other
Class A Class B Comprehensive Total
Common Stock Common Stock Treasury Stock
Paid-in Retained Income Stockholder's
Shares Amount Shares Amount Capital Earnings (Loss) Shares Amount Equity
Balances as of March 31, 2003 ÏÏÏÏ 288,267 2,883 225 2 856,428 923,892 1,534 Ì Ì 1,784,739
Components of comprehensive
income:
Net income ÏÏÏÏÏÏÏÏÏÏÏÏÏÏÏÏÏÏ Ì Ì Ì Ì Ì 577,292 Ì Ì Ì 577,292
Change in unrealized gain (loss)
on investments, net ÏÏÏÏÏÏÏÏÏÏ Ì Ì Ì Ì Ì Ì (1,102) Ì Ì (1,102)
ReclassiÑcation adjustment for
losses, realized in net income,
netÏÏÏÏÏÏÏÏÏÏÏÏÏÏÏÏÏÏÏÏÏÏÏÏ Ì Ì Ì Ì Ì Ì 913 Ì Ì 913
Translation adjustment ÏÏÏÏÏÏÏÏÏ Ì Ì Ì Ì Ì Ì 19,134 Ì Ì 19,134
Comprehensive income ÏÏÏÏÏÏ 596,237
Proceeds from sales of shares
through stock plansÏÏÏÏÏÏÏÏÏÏÏÏ 13,066 130 Ì Ì 227,690 Ì Ì Ì Ì 227,820
Repurchase of Class B shares ÏÏÏÏÏ Ì Ì (25) Ì (225) Ì Ì Ì Ì (225)
Repayment of notes receivable ÏÏÏÏ Ì Ì Ì Ì 128 Ì Ì Ì Ì 128
Stock-based compensation ÏÏÏÏÏÏÏÏ Ì Ì Ì Ì 1,027 Ì Ì Ì Ì 1,027
Tax beneÑt from exercise of stock
options ÏÏÏÏÏÏÏÏÏÏÏÏÏÏÏÏÏÏÏÏÏÏ Ì Ì Ì Ì 68,632 Ì Ì Ì Ì 68,632
Balances as of March 31, 2004 ÏÏÏÏ 301,333 $3,013 200 $ 2 $1,153,680 $1,501,184 $ 20,479 Ì $ Ì $2,678,358
See accompanying Notes to Consolidated Financial Statements.
58