Electronic Arts 2013 Annual Report Download - page 123
Download and view the complete annual report
Please find page 123 of the 2013 Electronic Arts annual report below. You can navigate through the pages in the report by either clicking on the pages listed below, or by using the keyword search tool below to find specific information within the annual report.-
 1
1 -
2
-
3
-
4
-
5
-
6
-
7
-
8
-
9
-
10
-
11
-
12
-
13
-
14
-
15
-
16
-
17
-
18
-
19
-
20
-
21
-
22
-
23
-
24
-
25
-
26
-
27
-
28
-
29
-
30
-
31
-
32
-
33
-
34
-
35
-
36
-
37
-
38
-
39
-
40
-
41
-
42
-
43
-
44
-
45
-
46
-
47
-
48
-
49
-
50
-
51
-
52
-
53
-
54
-
55
-
56
-
57
-
58
-
59
-
60
-
61
-
62
-
63
-
64
-
65
-
66
-
67
-
68
-
69
-
70
-
71
-
72
-
73
-
74
-
75
-
76
-
77
-
78
-
79
-
80
-
81
-
82
-
83
-
84
-
85
-
86
-
87
-
88
-
89
-
90
-
91
-
92
-
93
-
94
-
95
-
96
-
97
-
98
-
99
-
100
-
101
-
102
-
103
-
104
-
105
-
106
-
107
-
108
-
109
-
110
-
111
-
112
-
 113
113 -
 114
114 -
 115
115 -
 116
116 -
 117
117 -
 118
118 -
 119
119 -
 120
120 -
 121
121 -
 122
122 -
 123
123 -
 124
124 -
 125
125 -
 126
126 -
 127
127 -
 128
128 -
 129
129 -
 130
130 -
 131
131 -
 132
132 -
 133
133 -
134
-
135
-
136
-
137
-
138
-
139
-
140
-
141
-
142
-
143
-
144
-
145
-
146
-
147
-
148
-
149
-
150
-
151
-
152
-
153
-
154
-
155
-
156
-
157
-
158
-
159
-
160
-
161
-
162
-
163
-
164
-
165
-
166
-
167
-
168
-
169
-
170
-
171
-
172
-
173
-
174
-
175
-
176
-
177
-
178
-
179
-
180
-
181
-
182
-
183
-
184
-
185
-
186
-
187
-
188
-
189
-
190
-
191
-
192
-
193
-
194
-
195
-
196
-
197
-
198
-
199
-
200
-
201
-
202
-
203
-
204
 |
 |

Annual Report
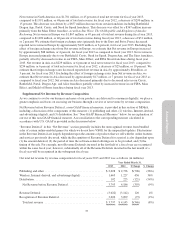
We anticipate that our fiscal year 2014 net revenue will be lower than our fiscal year 2013 net revenue as a result
of a change in our estimated offering period, partially offset by an increase in sales. While we have not
completed our evaluation of our estimated offering period for fiscal year 2014, we anticipate our weighted-
average estimated offering period for our products and services to be longer than our historical experience of
generally six months as consumers are spending more time playing our games online. We do not expect this
change in estimated offering period to impact the amount of Net Revenue before Revenue Deferral or operating
cash flows we report. We expect net revenue to be up to $500 million lower than Net Revenue Before Deferral in
fiscal year 2014 due primarily to the change in estimated offering period.
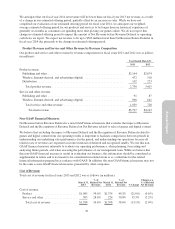
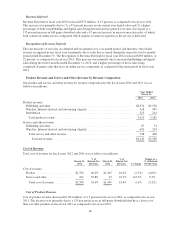
Product Revenue and Service and Other Revenue by Revenue Composition
Our product and service and other revenue by revenue composition for fiscal years 2013 and 2012 was as follows
(in millions):
Year Ended March 31
2013 2012
Product revenue:
Publishing and other .................................................... $2,164 $2,674
Wireless, Internet-derived, and advertising (digital) ........................... 472 518
Distribution ........................................................... 102 223
Total product revenue ................................................. 2,738 3,415
Service and other revenue:
Publishing and other .................................................... 91 87
Wireless, Internet-derived, and advertising (digital) ........................... 968 641
Total service and other revenue ......................................... 1,059 728
Total net revenue .................................................. $3,797 $4,143
Non-GAAP Financial Measures
Net Revenue before Revenue Deferral is a non-GAAP financial measure that excludes the impact of Revenue
Deferral and the Recognition of Revenue Deferral on Net Revenue related to sales of games and digital content.
We believe that excluding the impact of Revenue Deferral and the Recognition of Revenue Deferral related to
games and digital content from our operating results is important to facilitate comparisons between periods in
understanding our underlying sales performance for the period, and understanding our operations because all
related costs of revenues are expensed as incurred instead of deferred and recognized ratably. We use this non-
GAAP financial measure internally to evaluate our operating performance, when planning, forecasting and
analyzing future periods, and when assessing the performance of our management team. While we believe that
this non-GAAP financial measure is useful in evaluating our business, this information should be considered as
supplemental in nature and is not meant to be considered in isolation from or as a substitute for the related
financial information prepared in accordance with GAAP. In addition, this non-GAAP financial measure may not
be the same as non-GAAP financial measures presented by other companies.
Cost of Revenue
Total cost of revenue for fiscal years 2013 and 2012 was as follows (in millions):
March 31,
2013
%of
Related Net
Revenue
March 31,
2012
%of
Related Net
Revenue % Change
Change as a
% of Related
Net Revenue
Cost of revenue:
Product .............................. $1,085 39.6% $1,374 40.2% (21.0%) (0.6%)
Service and other ...................... 303 28.6% 224 30.8% 35.3% (2.2%)
Total cost of revenue ................. $1,388 36.6% $1,598 38.6% (13.1%) (2.0%)
39