Electronic Arts 2013 Annual Report Download - page 189
Download and view the complete annual report
Please find page 189 of the 2013 Electronic Arts annual report below. You can navigate through the pages in the report by either clicking on the pages listed below, or by using the keyword search tool below to find specific information within the annual report.-
 1
1 -
2
-
3
-
4
-
5
-
6
-
7
-
8
-
9
-
10
-
11
-
12
-
13
-
14
-
15
-
16
-
17
-
18
-
19
-
20
-
21
-
22
-
23
-
24
-
25
-
26
-
27
-
28
-
29
-
30
-
31
-
32
-
33
-
34
-
35
-
36
-
37
-
38
-
39
-
40
-
41
-
42
-
43
-
44
-
45
-
46
-
47
-
48
-
49
-
50
-
51
-
52
-
53
-
54
-
55
-
56
-
57
-
58
-
59
-
60
-
61
-
62
-
63
-
64
-
65
-
66
-
67
-
68
-
69
-
70
-
71
-
72
-
73
-
74
-
75
-
76
-
77
-
78
-
79
-
80
-
81
-
82
-
83
-
84
-
85
-
86
-
87
-
88
-
89
-
90
-
91
-
92
-
93
-
94
-
95
-
96
-
97
-
98
-
99
-
100
-
101
-
102
-
103
-
104
-
105
-
106
-
107
-
108
-
109
-
110
-
111
-
112
-
113
-
114
-
115
-
116
-
117
-
118
-
119
-
120
-
121
-
122
-
123
-
124
-
125
-
126
-
127
-
128
-
129
-
130
-
131
-
132
-
133
-
134
-
135
-
136
-
137
-
138
-
139
-
140
-
141
-
142
-
143
-
144
-
145
-
146
-
147
-
148
-
149
-
150
-
151
-
152
-
153
-
154
-
155
-
156
-
157
-
158
-
159
-
160
-
161
-
162
-
163
-
164
-
165
-
166
-
167
-
168
-
169
-
170
-
171
-
172
-
173
-
174
-
175
-
176
-
177
-
178
-
 179
179 -
 180
180 -
 181
181 -
 182
182 -
 183
183 -
 184
184 -
 185
185 -
 186
186 -
 187
187 -
 188
188 -
 189
189 -
 190
190 -
 191
191 -
 192
192 -
 193
193 -
 194
194 -
 195
195 -
 196
196 -
 197
197 -
 198
198 -
 199
199 -
200
-
201
-
202
-
203
-
204
 |
 |

Annual Report
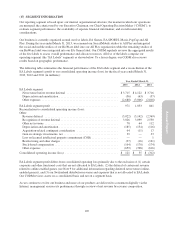
(18) QUARTERLY FINANCIAL AND MARKET INFORMATION (UNAUDITED)
Quarter Ended Year
Ended(In millions, except per share data) June 30 September 30 December 31 March 31
Fiscal 2013 Consolidated
Net revenue ................................... $ 955 $ 711 $ 922 $1,209 $3,797
Gross profit ................................... 750 266 493 900 2,409
Operating income (loss) ......................... 215 (364) (39) 309 121
Net income (loss) ............................... 201
(a) (381)(b) (45)(c) 323(d) 98
Common Stock
Net income (loss) per share — Basic ............... $ 0.63 $ (1.21) $ (0.15) $ 1.07 $ 0.32
Net income (loss) per share — Diluted .............. $ 0.63 $ (1.21) $ (0.15) $ 1.05 $ 0.31
Common stock price per share
High ....................................... $16.71 $14.50 $15.42 $19.34 $19.34
Low ....................................... $11.89 $10.94 $11.91 $13.70 $10.94
Fiscal 2012 Consolidated
Net revenue ................................... $ 999 $ 715 $1,061 $1,368 $4,143
Gross profit ................................... 759 283 509 994 2,545
Operating income (loss) ......................... 227 (374) (183) 365 35
Net income (loss) ............................... 221
(e) (340)(f) (205)(g) 400(h) 76
Common Stock
Net income (loss) per share — Basic ............... $ 0.67 $ (1.03) $ (0.62) $ 1.22 $ 0.23
Net income (loss) per share — Diluted .............. $ 0.66 $ (1.03) $ (0.62) $ 1.20 $ 0.23
Common stock price per share
High ....................................... $24.42 $25.05 $25.20 $21.30 $25.20
Low ....................................... $19.69 $17.62 $19.76 $16.34 $16.34
(a) Net income includes restructuring charges of $27 million and $(20) million of acquisition-related contingent
consideration, both of which are pre-tax amounts.
(b) Net loss includes pre-tax restructuring charges of $(2) million.
(c) Net loss includes $(45) million of acquisition-related contingent consideration, $(14) million gain on
strategic investments, net, $6 million of impairment charges on acquisition-related intangible assets, and
restructuring charges of $2 million, all of which are pre-tax amounts.
(d) Net income includes $31 million of impairment charges on acquisition-related intangible assets,
$(25) million of gain on strategic investments, net, and $1 million of acquisition-related contingent
consideration, both of which are pre-tax amounts.
(e) Net income includes restructuring charges of $18 million and $2 million of acquisition-related contingent
consideration, both of which are pre-tax amounts.
(f) Net loss includes restructuring charges of $(1) million and $17 million of acquisition-related contingent
consideration, both of which are pre-tax amounts.
(g) Net loss includes $(11) million of pre-tax acquisition-related contingent consideration.
(h) Net income includes $12 million of impairment charges on acquisition-related intangible assets, $3 million
of acquisition-related contingent consideration, restructuring charges of $(1) million, and $27 million of
litigation expenses, all of which are pre-tax amounts.
Our common stock is traded on the NASDAQ Global Select Market under the symbol “EA”. Our symbol
changed from “ERTS” to “EA” on December 20, 2011. The prices for the common stock in the table above
represent the high and low sales prices as reported on the NASDAQ Global Select Market.
105