Electronic Arts 2013 Annual Report Download - page 159
Download and view the complete annual report
Please find page 159 of the 2013 Electronic Arts annual report below. You can navigate through the pages in the report by either clicking on the pages listed below, or by using the keyword search tool below to find specific information within the annual report.-
 1
1 -
2
-
3
-
4
-
5
-
6
-
7
-
8
-
9
-
10
-
11
-
12
-
13
-
14
-
15
-
16
-
17
-
18
-
19
-
20
-
21
-
22
-
23
-
24
-
25
-
26
-
27
-
28
-
29
-
30
-
31
-
32
-
33
-
34
-
35
-
36
-
37
-
38
-
39
-
40
-
41
-
42
-
43
-
44
-
45
-
46
-
47
-
48
-
49
-
50
-
51
-
52
-
53
-
54
-
55
-
56
-
57
-
58
-
59
-
60
-
61
-
62
-
63
-
64
-
65
-
66
-
67
-
68
-
69
-
70
-
71
-
72
-
73
-
74
-
75
-
76
-
77
-
78
-
79
-
80
-
81
-
82
-
83
-
84
-
85
-
86
-
87
-
88
-
89
-
90
-
91
-
92
-
93
-
94
-
95
-
96
-
97
-
98
-
99
-
100
-
101
-
102
-
103
-
104
-
105
-
106
-
107
-
108
-
109
-
110
-
111
-
112
-
113
-
114
-
115
-
116
-
117
-
118
-
119
-
120
-
121
-
122
-
123
-
124
-
125
-
126
-
127
-
128
-
129
-
130
-
131
-
132
-
133
-
134
-
135
-
136
-
137
-
138
-
139
-
140
-
141
-
142
-
143
-
144
-
145
-
146
-
147
-
148
-
 149
149 -
 150
150 -
 151
151 -
 152
152 -
 153
153 -
 154
154 -
 155
155 -
 156
156 -
 157
157 -
 158
158 -
 159
159 -
 160
160 -
 161
161 -
 162
162 -
 163
163 -
 164
164 -
 165
165 -
 166
166 -
 167
167 -
 168
168 -
 169
169 -
170
-
171
-
172
-
173
-
174
-
175
-
176
-
177
-
178
-
179
-
180
-
181
-
182
-
183
-
184
-
185
-
186
-
187
-
188
-
189
-
190
-
191
-
192
-
193
-
194
-
195
-
196
-
197
-
198
-
199
-
200
-
201
-
202
-
203
-
204
 |
 |

Annual Report
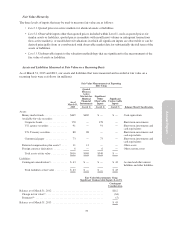
Fair Value Hierarchy
The three levels of inputs that may be used to measure fair value are as follows:
•Level 1. Quoted prices in active markets for identical assets or liabilities.
•Level 2. Observable inputs other than quoted prices included within Level 1, such as quoted prices for
similar assets or liabilities, quoted prices in markets with insufficient volume or infrequent transactions
(less active markets), or model-derived valuations in which all significant inputs are observable or can be
derived principally from or corroborated with observable market data for substantially the full term of the
assets or liabilities.
•Level 3. Unobservable inputs to the valuation methodology that are significant to the measurement of the
fair value of assets or liabilities.
Assets and Liabilities Measured at Fair Value on a Recurring Basis
As of March 31, 2013 and 2012, our assets and liabilities that were measured and recorded at fair value on a
recurring basis were as follows (in millions):
Fair Value Measurements at Reporting
Date Using
As of
March 31,
2013
Quoted
Prices in
Active
Markets for
Identical
Financial
Instruments
Significant
Other
Observable
Inputs
Significant
Unobservable
Inputs
(Level 1) (Level 2) (Level 3) Balance Sheet Classification
Assets
Money market funds ................. $469 $469 $ — $ — Cash equivalents
Available-for-sale securities:
Corporate bonds .................. 178 — 178 — Short-term investments
U.S. agency securities ............. 91 — 91 — Short-term investments and
cash equivalents
U.S. Treasury securities ............ 88 88 — — Short-term investments and
cash equivalents
Commercial paper ................ 73 — 73 — Short-term investments and
cash equivalents
Deferred compensation plan assets(a) .... 11 11 — — Other assets
Foreign currency derivatives .......... 6 — 6 — Other current assets
Total assets at fair value ............ $916 $568 $348 $ —
Liabilities
Contingent consideration(b) ............ $ 43 $ — $ — $ 43 Accruedandothercurrent
liabilities and other liabilities
Total liabilities at fair value ......... $ 43 $ — $ — $ 43
Fair Value Measurements Using
Significant Unobservable Inputs (Level 3)
Contingent
Consideration
Balance as of March 31, 2012 ...................................... $112
Change in fair value(c) ........................................... (64)
Payments(d) ................................................... (5)
Balance as of March 31, 2013 ...................................... $ 43
75