Electronic Arts 2013 Annual Report Download - page 188
Download and view the complete annual report
Please find page 188 of the 2013 Electronic Arts annual report below. You can navigate through the pages in the report by either clicking on the pages listed below, or by using the keyword search tool below to find specific information within the annual report.-
 1
1 -
2
-
3
-
4
-
5
-
6
-
7
-
8
-
9
-
10
-
11
-
12
-
13
-
14
-
15
-
16
-
17
-
18
-
19
-
20
-
21
-
22
-
23
-
24
-
25
-
26
-
27
-
28
-
29
-
30
-
31
-
32
-
33
-
34
-
35
-
36
-
37
-
38
-
39
-
40
-
41
-
42
-
43
-
44
-
45
-
46
-
47
-
48
-
49
-
50
-
51
-
52
-
53
-
54
-
55
-
56
-
57
-
58
-
59
-
60
-
61
-
62
-
63
-
64
-
65
-
66
-
67
-
68
-
69
-
70
-
71
-
72
-
73
-
74
-
75
-
76
-
77
-
78
-
79
-
80
-
81
-
82
-
83
-
84
-
85
-
86
-
87
-
88
-
89
-
90
-
91
-
92
-
93
-
94
-
95
-
96
-
97
-
98
-
99
-
100
-
101
-
102
-
103
-
104
-
105
-
106
-
107
-
108
-
109
-
110
-
111
-
112
-
113
-
114
-
115
-
116
-
117
-
118
-
119
-
120
-
121
-
122
-
123
-
124
-
125
-
126
-
127
-
128
-
129
-
130
-
131
-
132
-
133
-
134
-
135
-
136
-
137
-
138
-
139
-
140
-
141
-
142
-
143
-
144
-
145
-
146
-
147
-
148
-
149
-
150
-
151
-
152
-
153
-
154
-
155
-
156
-
157
-
158
-
159
-
160
-
161
-
162
-
163
-
164
-
165
-
166
-
167
-
168
-
169
-
170
-
171
-
172
-
173
-
174
-
175
-
176
-
177
-
 178
178 -
 179
179 -
 180
180 -
 181
181 -
 182
182 -
 183
183 -
 184
184 -
 185
185 -
 186
186 -
 187
187 -
 188
188 -
 189
189 -
 190
190 -
 191
191 -
 192
192 -
 193
193 -
 194
194 -
 195
195 -
 196
196 -
 197
197 -
 198
198 -
199
-
200
-
201
-
202
-
203
-
204
 |
 |

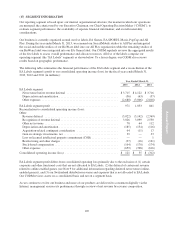
Information about our total net revenue by revenue composition for the fiscal years ended March 31, 2013, 2012
and 2011 is presented below (in millions):
Year Ended March 31,
2013 2012 2011
Publishing and other .................................................... $2,255 $2,761 $2,632
Wireless, Internet-derived, advertising (digital) .............................. 1,440 1,159 743
Distribution ........................................................... 102 223 214
Net revenue ........................................................ $3,797 $4,143 $3,589
Information about our operations in North America, Europe and Asia as of and for the fiscal years ended
March 31, 2013, 2012 and 2011 is presented below (in millions):
Year Ended March 31,
2013 2012 2011
Net revenue from unaffiliated customers
North America ...................................................... $1,701 $1,991 $1,836
Europe ............................................................ 1,867 1,898 1,563
Asia ............................................................... 229 254 190
Total ............................................................ $3,797 $4,143 $3,589
As of March 31,
2013 2012
Long-lived assets
North America .............................................................. $2,024 $2,165
Europe .................................................................... 451 442
Asia ...................................................................... 47 48
Total ................................................................... $2,522 $2,655
The basis by which we attribute net revenue from external customers to individual countries is based on the
location of the legal entity that sells the products and/or services. Revenue generated in the United States
represents over 99 percent of our total North America net revenue. Revenue generated in Switzerland during
fiscal years 2013 and 2012 represents $885 million and $589 million or 23 percent and 14 percent of our total net
revenue, respectively. Revenue generated in Switzerland did not represent 10 percent or greater of our total net
revenue during fiscal year 2011. Revenue generated in United Kingdom did not represent 10 percent or greater of
our total net revenue during fiscal years 2013 and 2012. Revenue generated in United Kingdom during fiscal year
2011 represents $411 million, or 11 percent of our total net revenue. There were no other countries with net
revenue greater than 10 percent.
Our direct sales to GameStop Corp. represented approximately 13 percent, 15 percent, and 16 percent of total net
revenue in fiscal years 2013, 2012, and 2011, respectively. Our direct sales to Wal-Mart Stores, Inc. represented
approximately 10 percent of total net revenue in fiscal year 2011. Our direct sales to Wal-Mart Stores, Inc. did
not exceed 10 percent of net revenue for fiscal years 2013 and 2012.
104