Electronic Arts 2013 Annual Report Download - page 128
Download and view the complete annual report
Please find page 128 of the 2013 Electronic Arts annual report below. You can navigate through the pages in the report by either clicking on the pages listed below, or by using the keyword search tool below to find specific information within the annual report.-
 1
1 -
2
-
3
-
4
-
5
-
6
-
7
-
8
-
9
-
10
-
11
-
12
-
13
-
14
-
15
-
16
-
17
-
18
-
19
-
20
-
21
-
22
-
23
-
24
-
25
-
26
-
27
-
28
-
29
-
30
-
31
-
32
-
33
-
34
-
35
-
36
-
37
-
38
-
39
-
40
-
41
-
42
-
43
-
44
-
45
-
46
-
47
-
48
-
49
-
50
-
51
-
52
-
53
-
54
-
55
-
56
-
57
-
58
-
59
-
60
-
61
-
62
-
63
-
64
-
65
-
66
-
67
-
68
-
69
-
70
-
71
-
72
-
73
-
74
-
75
-
76
-
77
-
78
-
79
-
80
-
81
-
82
-
83
-
84
-
85
-
86
-
87
-
88
-
89
-
90
-
91
-
92
-
93
-
94
-
95
-
96
-
97
-
98
-
99
-
100
-
101
-
102
-
103
-
104
-
105
-
106
-
107
-
108
-
109
-
110
-
111
-
112
-
113
-
114
-
115
-
116
-
117
-
 118
118 -
 119
119 -
 120
120 -
 121
121 -
 122
122 -
 123
123 -
 124
124 -
 125
125 -
 126
126 -
 127
127 -
 128
128 -
 129
129 -
 130
130 -
 131
131 -
 132
132 -
 133
133 -
 134
134 -
 135
135 -
 136
136 -
 137
137 -
 138
138 -
139
-
140
-
141
-
142
-
143
-
144
-
145
-
146
-
147
-
148
-
149
-
150
-
151
-
152
-
153
-
154
-
155
-
156
-
157
-
158
-
159
-
160
-
161
-
162
-
163
-
164
-
165
-
166
-
167
-
168
-
169
-
170
-
171
-
172
-
173
-
174
-
175
-
176
-
177
-
178
-
179
-
180
-
181
-
182
-
183
-
184
-
185
-
186
-
187
-
188
-
189
-
190
-
191
-
192
-
193
-
194
-
195
-
196
-
197
-
198
-
199
-
200
-
201
-
202
-
203
-
204
 |
 |

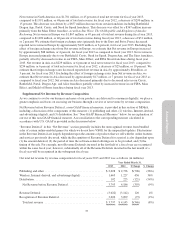
Comparison of Fiscal Year 2012 to Fiscal Year 2011
Net Revenue
For fiscal year 2012, Net Revenue was $4,143 million and increased $554 million, or 15 percent, as compared to
fiscal year 2011. This increase was driven by a $1,312 million increase in revenue primarily from the Battlefield,
Crysis, and FIFA franchises. This increase was offset by a $758 million decrease in revenue primarily from the
Medal of Honor, FIFA World Cup, and Army of Two franchises, as well as Dante’s Inferno, for which there
were no iterations in fiscal year 2012.
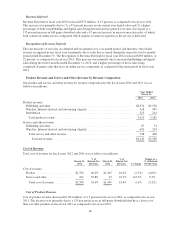
Net Revenue by Product Revenue and Service and Other Revenue
Our total net revenue by product revenue and service and other revenue for the fiscal years ended March 31,
2012 and 2011 was as follows (in millions):
Year Ended March 31,
2012 2011 $ Change % Change
Net revenue:
Product ................................................ $3,415 $3,181 $234 7%
Service and other ........................................ 728 408 320 78%
Total net revenue ...................................... $4,143 $3,589 $554 15%
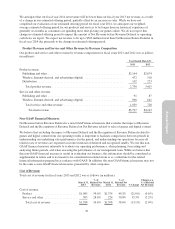
Product Revenue
For fiscal year 2012, product revenue was $3,415 million, primarily driven by FIFA 12, Battlefield 3, and
Madden NFL 12. Product revenue for fiscal year 2012 increased $234 million, or 7 percent, as compared to fiscal
year 2011. This increase was driven by a $937 million increase primarily from the Battlefield, Crysis, and FIFA
franchises. This increase was offset by a $703 million decrease primarily from the FIFA World Cup, Medal of
Honor, Rock Band, and Army of Two franchises, as well as Dante’s Inferno.
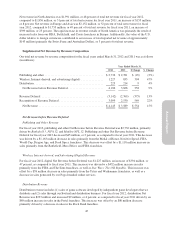
Service and Other Revenue
For fiscal year 2012, service and other revenue was $728 million, primarily driven by (1) Star Wars: The Old
Republic, which was launched in the third quarter, (2) our micro-transactions revenue from browser-based games
including games played on Facebook such as The Sims Social, and (3) our FIFA Ultimate Team add-on game
service. Service and other revenue for fiscal year 2012 increased $320 million, or 78 percent, as compared to
fiscal year 2011. This increase was primarily driven by a $351 million increase from certain services associated
with the FIFA and The Sims franchises, as well as Star Wars: The Old Republic. This increase was partially
offset by a $31 million decrease in service revenue generated by our Pogo-branded online game services and the
Warhammer and Ultima Online MMO franchises. In fiscal year 2013, we expect to increase our total service
revenue as compared to fiscal year 2012.
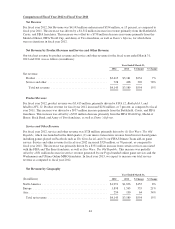
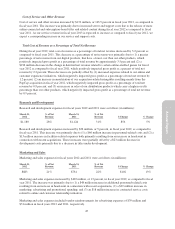
Net Revenue by Geography
Year Ended March 31,
(In millions) 2012 2011 $ Change % Change
North America ............................................ $1,991 $1,836 $155 8%
Europe .................................................. 1,898 1,563 335 21%
Asia ..................................................... 254 190 64 34%
Total net revenue ........................................ $4,143 $3,589 $554 15%
44