Electronic Arts 2013 Annual Report Download - page 54
Download and view the complete annual report
Please find page 54 of the 2013 Electronic Arts annual report below. You can navigate through the pages in the report by either clicking on the pages listed below, or by using the keyword search tool below to find specific information within the annual report.-
 1
1 -
2
-
3
-
4
-
5
-
6
-
7
-
8
-
9
-
10
-
11
-
12
-
13
-
14
-
15
-
16
-
17
-
18
-
19
-
20
-
21
-
22
-
23
-
24
-
25
-
26
-
27
-
28
-
29
-
30
-
31
-
32
-
33
-
34
-
35
-
36
-
37
-
38
-
39
-
40
-
41
-
42
-
43
-
 44
44 -
 45
45 -
 46
46 -
 47
47 -
 48
48 -
 49
49 -
 50
50 -
 51
51 -
 52
52 -
 53
53 -
 54
54 -
 55
55 -
 56
56 -
 57
57 -
 58
58 -
 59
59 -
 60
60 -
 61
61 -
 62
62 -
 63
63 -
 64
64 -
65
-
66
-
67
-
68
-
69
-
70
-
71
-
72
-
73
-
74
-
75
-
76
-
77
-
78
-
79
-
80
-
81
-
82
-
83
-
84
-
85
-
86
-
87
-
88
-
89
-
90
-
91
-
92
-
93
-
94
-
95
-
96
-
97
-
98
-
99
-
100
-
101
-
102
-
103
-
104
-
105
-
106
-
107
-
108
-
109
-
110
-
111
-
112
-
113
-
114
-
115
-
116
-
117
-
118
-
119
-
120
-
121
-
122
-
123
-
124
-
125
-
126
-
127
-
128
-
129
-
130
-
131
-
132
-
133
-
134
-
135
-
136
-
137
-
138
-
139
-
140
-
141
-
142
-
143
-
144
-
145
-
146
-
147
-
148
-
149
-
150
-
151
-
152
-
153
-
154
-
155
-
156
-
157
-
158
-
159
-
160
-
161
-
162
-
163
-
164
-
165
-
166
-
167
-
168
-
169
-
170
-
171
-
172
-
173
-
174
-
175
-
176
-
177
-
178
-
179
-
180
-
181
-
182
-
183
-
184
-
185
-
186
-
187
-
188
-
189
-
190
-
191
-
192
-
193
-
194
-
195
-
196
-
197
-
198
-
199
-
200
-
201
-
202
-
203
-
204
 |
 |

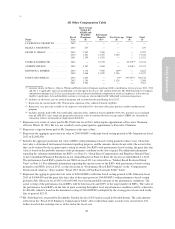
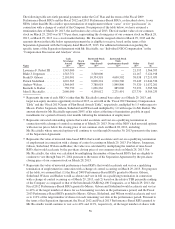
FISCAL 2013 SUMMARY COMPENSATION TABLE
The following table shows information concerning the compensation earned by or awarded to our Executive
Chairman, our Chief Financial Officer, our next three most highly compensated executive officers, our former
Interim Chief Financial Officer, and our former Chief Executive Officer for fiscal 2013 and, where applicable,
fiscal 2012 and 2011. For purposes of the compensation tables that follow, we refer to these individuals
collectively as the “Named Executive Officers” or “NEOs”.
Name and Principal Position
Fiscal
Year
Salary
($)
Bonus
($)
Stock
Awards
($)(1)
Option
Awards
($)(2)
Non-Equity
Incentive Plan
Compensation
($)(3)
All Other
Compensation
($)(4)
Total
($)
LAWRENCE F. PROBST III . . . 2013 39,615(5) — — — — — 39,615
Executive Chairman
BLAKE J. JORGENSEN ....... 2013 362,500 350,000(6) 2,842,000(7) — 269,208 657 3,824,365
Executive Vice President and
Chief Financial Officer
FRANK D. GIBEAU .......... 2013 694,923 — 5,609,000(8)(9) — — 8,787 6,312,710
President, EA Labels 2012 624,577 — 8,277,500 — 775,000 13,614 9,690,691
2011 591,538 — 2,308,800 — 1,180,000 12,321 4,092,659
PATRICK SÖDERLUND(10) .... 2013 584,583 4,283,250(8)(11) — 259,050 67,154 5,194,037
Executive Vice President EA
Games
ANDREW WILSON .......... 2013 510,865 4,283,250(8)(12) — 827,488 10,373 5,631,976
Executive Vice President EA
Sports
KENNETH A. BARKER ....... 2013 510,288 — 466,125(13) — 206,228 8,825 1,191,466
Senior Vice President,
Chief Accounting Officer and
Former Interim Chief Financial
Officer
2012 426,945 — 1,551,550 — 355,000 14,221 2,347,716
JOHN S. RICCITIELLO(14) ..... 2013 1,021,538 — 14,523,015(15) 98,340(16) — 198,414 15,841,307
Former Chief Executive
Officer
2012 865,538 — 7,015,000 — 1,500,525 2,589 9,383,652
2011 800,000 — 3,508,000 — 1,600,000 2,501 5,910,501
(1) Represents the aggregate grant date and, where applicable, incremental fair value of RSUs with time-based and, where
applicable, performance-based vesting granted or modified in those years. Grant date fair value is determined for financial
statement reporting purposes and the amounts shown do not reflect the actual value realized by the recipient. For RSUs
with time-based vesting, grant date fair value is calculated using the closing price of our common stock on the grant date.
Refer to footnote 8 below for a discussion of the fair value calculation for RSUs with performance-based vesting. For
additional information regarding the valuation methodology for RSUs, see Note 14, “Stock-Based Compensation and
Employee Benefit Plans”, to the Consolidated Financial Statements in our Annual Report on Form 10-K for the fiscal year
ended March 31, 2013. For additional information regarding the specific terms of the RSUs with time-based vesting
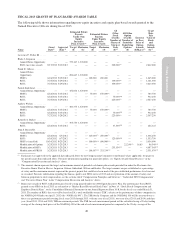
granted to our NEOs in fiscal 2013, see the “Fiscal 2013 Grants of Plan-Based Awards Table” below.
(2) Represents the grant date fair value of stock options granted or modified in those years. For additional information on the
valuation methodology and assumptions used to calculate the fair value of stock options, see Note 14, “Stock-Based
Compensation and Employee Benefit Plans”, of the Consolidated Financial Statements in our Annual Report on Form 10-K
for the fiscal year ended March 31, 2013.
(3) Represents amounts awarded under the Electronic Arts Inc. Executive Bonus Plan (“Executive Bonus Plan”) for fiscal
2013 for Messrs. Jorgensen, Wilson, and Barker and a discretionary cash bonus awarded under the EA Bonus Plan to
Messrs. Söderlund and Wilson in recognition of certain achievements, as discussed in the “Compensation Discussion and
Analysis” above. For additional information about the bonuses paid to our NEOs in fiscal 2013, see “Executive Bonus
Plan” and “EA Bonus Plan” in the “Compensation Discussion and Analysis” above. In fiscal 2012, bonus amounts for
Messrs. Riccitiello and Gibeau were awarded under the Executive Bonus Plan and the amount awarded to Mr. Barker was
awarded under the EA Bonus Plan. In fiscal 2011, bonus amounts for Messrs. Riccitiello and Gibeau were awarded under
the Executive Bonus Plan.
46