Electronic Arts 2013 Annual Report Download - page 148
Download and view the complete annual report
Please find page 148 of the 2013 Electronic Arts annual report below. You can navigate through the pages in the report by either clicking on the pages listed below, or by using the keyword search tool below to find specific information within the annual report.-
 1
1 -
2
-
3
-
4
-
5
-
6
-
7
-
8
-
9
-
10
-
11
-
12
-
13
-
14
-
15
-
16
-
17
-
18
-
19
-
20
-
21
-
22
-
23
-
24
-
25
-
26
-
27
-
28
-
29
-
30
-
31
-
32
-
33
-
34
-
35
-
36
-
37
-
38
-
39
-
40
-
41
-
42
-
43
-
44
-
45
-
46
-
47
-
48
-
49
-
50
-
51
-
52
-
53
-
54
-
55
-
56
-
57
-
58
-
59
-
60
-
61
-
62
-
63
-
64
-
65
-
66
-
67
-
68
-
69
-
70
-
71
-
72
-
73
-
74
-
75
-
76
-
77
-
78
-
79
-
80
-
81
-
82
-
83
-
84
-
85
-
86
-
87
-
88
-
89
-
90
-
91
-
92
-
93
-
94
-
95
-
96
-
97
-
98
-
99
-
100
-
101
-
102
-
103
-
104
-
105
-
106
-
107
-
108
-
109
-
110
-
111
-
112
-
113
-
114
-
115
-
116
-
117
-
118
-
119
-
120
-
121
-
122
-
123
-
124
-
125
-
126
-
127
-
128
-
129
-
130
-
131
-
132
-
133
-
134
-
135
-
136
-
137
-
 138
138 -
 139
139 -
 140
140 -
 141
141 -
 142
142 -
 143
143 -
 144
144 -
 145
145 -
 146
146 -
 147
147 -
 148
148 -
 149
149 -
 150
150 -
 151
151 -
 152
152 -
 153
153 -
 154
154 -
 155
155 -
 156
156 -
 157
157 -
 158
158 -
159
-
160
-
161
-
162
-
163
-
164
-
165
-
166
-
167
-
168
-
169
-
170
-
171
-
172
-
173
-
174
-
175
-
176
-
177
-
178
-
179
-
180
-
181
-
182
-
183
-
184
-
185
-
186
-
187
-
188
-
189
-
190
-
191
-
192
-
193
-
194
-
195
-
196
-
197
-
198
-
199
-
200
-
201
-
202
-
203
-
204
 |
 |

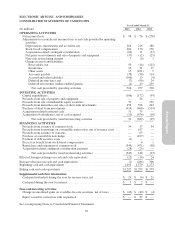
ELECTRONIC ARTS INC. AND SUBSIDIARIES
CONSOLIDATED STATEMENTS OF STOCKHOLDERS’ EQUITY
(In millions, share data in thousands)
Common Stock Paid-in
Capital
Retained
Earnings
(Accumulated
Deficit)
Accumulated
Other
Comprehensive
Income
Total
Stockholders’
EquityShares Amount
Balances as of March 31, 2010 ........... 329,587 $ 3 $2,375 $ 123 $ 228 $2,729
Total comprehensive loss ................ — — — (276) (9) (285)
Issuance of common stock ............... 6,081 — 4 — — 4
Repurchase and retirement of common
stock .............................. (3,104) — (58) — — (58)
Stock-based compensation ............... — — 176 — — 176
Tax costs from exercise of stock options .... — — (2) — — (2)
Balances as of March 31, 2011 ........... 332,564 3 2,495 (153) 219 2,564
Total comprehensive income ............. — — — 76 (46) 30
Issuance of common stock ............... 7,850 — 12 — — 12
Equity issued in connection with
acquisition ......................... 4,356 — 87 — — 87
Equity value of convertible note issuance,
net................................ — — 105 — — 105
Purchase of convertible note hedge ........ — — (107) — — (107)
Sale of common stock warrants ........... — — 65 — — 65
Repurchase and retirement of common
stock .............................. (24,547) — (471) — — (471)
Stock-based compensation ............... — — 170 — — 170
Tax benefit from exercise of stock options . . — — 3 — — 3
Balances as of March 31, 2012 ........... 320,223 3 2,359 (77) 173 2,458
Total comprehensive loss ................ — — — 98 (104) (6)
Issuance of common stock ............... 7,801 — 1 — — 1
Repurchase and retirement of common
stock .............................. (25,860) — (349) — — (349)
Stock-based compensation ............... — — 164 — — 164
Tax costs from exercise of stock options .... — — (1) — — (1)
Balances as of March 31, 2013 ........... 302,164 $ 3 $2,174 $ 21 $ 69 $2,267
See accompanying Notes to Consolidated Financial Statements.
64