Electronic Arts 2013 Annual Report Download - page 168
Download and view the complete annual report
Please find page 168 of the 2013 Electronic Arts annual report below. You can navigate through the pages in the report by either clicking on the pages listed below, or by using the keyword search tool below to find specific information within the annual report.-
 1
1 -
2
-
3
-
4
-
5
-
6
-
7
-
8
-
9
-
10
-
11
-
12
-
13
-
14
-
15
-
16
-
17
-
18
-
19
-
20
-
21
-
22
-
23
-
24
-
25
-
26
-
27
-
28
-
29
-
30
-
31
-
32
-
33
-
34
-
35
-
36
-
37
-
38
-
39
-
40
-
41
-
42
-
43
-
44
-
45
-
46
-
47
-
48
-
49
-
50
-
51
-
52
-
53
-
54
-
55
-
56
-
57
-
58
-
59
-
60
-
61
-
62
-
63
-
64
-
65
-
66
-
67
-
68
-
69
-
70
-
71
-
72
-
73
-
74
-
75
-
76
-
77
-
78
-
79
-
80
-
81
-
82
-
83
-
84
-
85
-
86
-
87
-
88
-
89
-
90
-
91
-
92
-
93
-
94
-
95
-
96
-
97
-
98
-
99
-
100
-
101
-
102
-
103
-
104
-
105
-
106
-
107
-
108
-
109
-
110
-
111
-
112
-
113
-
114
-
115
-
116
-
117
-
118
-
119
-
120
-
121
-
122
-
123
-
124
-
125
-
126
-
127
-
128
-
129
-
130
-
131
-
132
-
133
-
134
-
135
-
136
-
137
-
138
-
139
-
140
-
141
-
142
-
143
-
144
-
145
-
146
-
147
-
148
-
149
-
150
-
151
-
152
-
153
-
154
-
155
-
156
-
157
-
 158
158 -
 159
159 -
 160
160 -
 161
161 -
 162
162 -
 163
163 -
 164
164 -
 165
165 -
 166
166 -
 167
167 -
 168
168 -
 169
169 -
 170
170 -
 171
171 -
 172
172 -
 173
173 -
 174
174 -
 175
175 -
 176
176 -
 177
177 -
 178
178 -
179
-
180
-
181
-
182
-
183
-
184
-
185
-
186
-
187
-
188
-
189
-
190
-
191
-
192
-
193
-
194
-
195
-
196
-
197
-
198
-
199
-
200
-
201
-
202
-
203
-
204
 |
 |

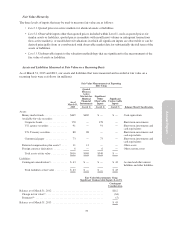
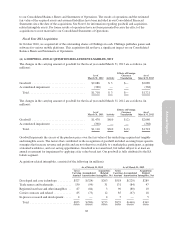
Amortization of intangibles and impairment charges recognized for our acquisition-related intangible assets for
the fiscal years ended March 31, 2013, 2012 and 2011 are classified in the Consolidated Statement of Operations
as follows (in millions):
Year Ended March 31,
2013 2012 2011
Cost of product ..................................................... $ 55 $35 $ 9
Cost of service and other ............................................. 38 17 3
Operating expenses .................................................. 30 43 57
Total ........................................................... $123 $95 $69
Acquisition-related intangible assets are amortized using the straight-line method over the lesser of their
estimated useful lives or the agreement terms, typically from 2 to 14 years. As of March 31, 2013 and 2012, the
weighted-average remaining useful life for acquisition-related intangible assets was approximately 3.9 years and
5.7 years for each period, respectively.
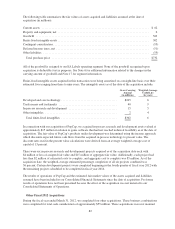
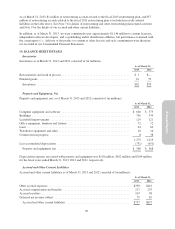
As of March 31, 2013, future amortization of finite-lived intangibles that will be recorded in cost of revenue and
operating expenses is estimated as follows (in millions):
Fiscal Year Ending March 31,
2014 ................................................................................. $ 74
2015 ................................................................................. 66
2016 ................................................................................. 53
2017 ................................................................................. 32
2018 ................................................................................. 13
Thereafter ............................................................................ 15
Total .............................................................................. $253
(7) RESTRUCTURING AND OTHER CHARGES
Restructuring and other restructuring plan-related information as of March 31, 2013 was as follows (in millions):
Fiscal 2013
Restructuring
Fiscal 2011
Restructuring
Other Restructurings
and Reorganization
Workforce
Facilities-
related Other Workforce Other Workforce
Facilities-
related Other Total
Balances as of March 31, 2010 ..... $— $— $— $— $ — $ 8 $14 $ 7 $ 29
Charges to operations .......... — — — 13 135 — — 13 161
Charges settled in cash ......... — — — (8) (32) (8) (7) (15) (70)
Charges settled in non-cash ...... — — — (2) (2) — 1 — (3)
Balances as of March 31, 2011 ..... — — — 3 101 — 8 5 117
Charges to operations .......... — — — (1) 21 — (12) 8 16
Charges settled in cash ......... — — — (2) (47) — 7 (13) (55)
Balances as of March 31, 2012 ..... — — — — 75 — 3 — 78
Charges to operations .......... 10 3 9 — 6 — (1) — 27
Charges settled in cash ......... (10) — (1) — (24) — (1) — (36)
Charges settled in non-cash ...... — (1) (7) — — — 1 — (7)
Balances as of March 31, 2013 ..... $— $ 2 $ 1 $— $ 57 $— $ 2 $— $ 62
84