Electronic Arts 2013 Annual Report Download - page 57
Download and view the complete annual report
Please find page 57 of the 2013 Electronic Arts annual report below. You can navigate through the pages in the report by either clicking on the pages listed below, or by using the keyword search tool below to find specific information within the annual report.-
 1
1 -
2
-
3
-
4
-
5
-
6
-
7
-
8
-
9
-
10
-
11
-
12
-
13
-
14
-
15
-
16
-
17
-
18
-
19
-
20
-
21
-
22
-
23
-
24
-
25
-
26
-
27
-
28
-
29
-
30
-
31
-
32
-
33
-
34
-
35
-
36
-
37
-
38
-
39
-
40
-
41
-
42
-
43
-
44
-
45
-
46
-
 47
47 -
 48
48 -
 49
49 -
 50
50 -
 51
51 -
 52
52 -
 53
53 -
 54
54 -
 55
55 -
 56
56 -
 57
57 -
 58
58 -
 59
59 -
 60
60 -
 61
61 -
 62
62 -
 63
63 -
 64
64 -
 65
65 -
 66
66 -
 67
67 -
68
-
69
-
70
-
71
-
72
-
73
-
74
-
75
-
76
-
77
-
78
-
79
-
80
-
81
-
82
-
83
-
84
-
85
-
86
-
87
-
88
-
89
-
90
-
91
-
92
-
93
-
94
-
95
-
96
-
97
-
98
-
99
-
100
-
101
-
102
-
103
-
104
-
105
-
106
-
107
-
108
-
109
-
110
-
111
-
112
-
113
-
114
-
115
-
116
-
117
-
118
-
119
-
120
-
121
-
122
-
123
-
124
-
125
-
126
-
127
-
128
-
129
-
130
-
131
-
132
-
133
-
134
-
135
-
136
-
137
-
138
-
139
-
140
-
141
-
142
-
143
-
144
-
145
-
146
-
147
-
148
-
149
-
150
-
151
-
152
-
153
-
154
-
155
-
156
-
157
-
158
-
159
-
160
-
161
-
162
-
163
-
164
-
165
-
166
-
167
-
168
-
169
-
170
-
171
-
172
-
173
-
174
-
175
-
176
-
177
-
178
-
179
-
180
-
181
-
182
-
183
-
184
-
185
-
186
-
187
-
188
-
189
-
190
-
191
-
192
-
193
-
194
-
195
-
196
-
197
-
198
-
199
-
200
-
201
-
202
-
203
-
204
 |
 |

Proxy Statement
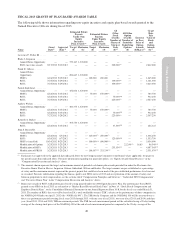
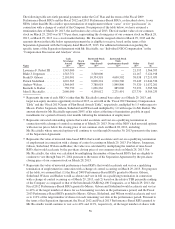
FISCAL 2013 GRANTS OF PLAN-BASED AWARDS TABLE
The following table shows information regarding non-equity incentive and equity plan-based awards granted to the
Named Executive Officers during fiscal 2013.
Name
Grant
Date(1)
Approval
Date(1)
Estimated Future
Payouts
Under Non-
Equity
Incentive
Plan Awards(2)
Estimated Future
Payouts
Under Equity
Incentive
Plan Awards
All
Other
Stock
Awards:
Number of
Shares of
Stock or
Units
(#)(4)
All Other
Option
Awards:
Number of
Securities
Underlying
Options
(#)
Exercise
or Base
Price of
Option
Awards
($/Share)(5)
Grant
Date
Fair
Value of
Stock
and
Option
Awards
($)(6)
Target
($)
Maximum
($)
Target
(#)
Maximum
(#)
Lawrence F. Probst III ..... — — — — — — — — — —
Blake J. Jorgensen ........
Annual Bonus Opportunity — — 379,167 1,320,000 — — — — — —
RSUs (new-hire award) 9/17/2012 9/13/2012 — — — — 200,000(7) 2,842,000
Frank D. Gibeau ..........
Annual Bonus
Opportunity — — 696,667 1,320,000 — — — — — —
PRSUs 6/18/2012 5/15/2012 — — 100,000 200,000 — — — 1,045,000
RSUs 7/27/2012 5/29/2012 — — — — 100,000(8) — — 1,141,000
RSUs 7/27/2012 5/29/2012 — — — — 300,000(9) — — 3,423,000
Patrick Söderlund .........
Annual Bonus Opportunity — — 456,064 1,320,000 — — — — — —
PRSUs 6/18/2012 5/15/2012 — — 75,000 150,000(3) — — — 783,750
RSUs 6/18/2012 5/15/2012 — — — — 75,000(10) — — 932,250
RSUs 7/27/2012 5/29/2012 — — — — 225,000(9) — — 2,567,250
Andrew Wilson ..........
Annual Bonus Opportunity — — 384,375 1,320,000 — — — — — —
PRSUs 6/18/2012 5/15/2012 — — 75,000 150,000(3) — — — 783,750
RSUs 6/18/2012 5/15/2012 — — — — 75,000(10) — — 932,250
RSUs 7/27/2012 5/29/2012 — — — — 225,000(9) — — 2,567,250
Kenneth A. Barker ........
Annual Bonus Opportunity — — 305,750 1,320,000 — — — — — —
RSUs 6/18/2012 5/15/2012 — — — — 37,500(10) — — 466,125
John S. Riccitiello .........
Annual Bonus Opportunity — — — — — — — — — —
PRSUs 6/18/2012 6/7/2012 — — 125,000(3) 250,000(3) — — — 1,306,250
RSUs 6/18/2012 6/7/2012 — — — — 125,000(10) — — 1,553,750
PRSUs (cancelled) 10/16/2012 9/25/2012 — — 300,000(11) 600,000(11) — — — 5,034,000
Modification of Options 3/25/2013 3/25/2013 — — — — — 22,240(12) 18.85 98,340(13)
Modification of RSUs 3/25/2013 3/25/2013 — — — — 233,334(14) — — 4,097,345(15)
Modification of PRSUs 3/25/2013 3/25/2013 — — 166,667(16) 333,334(16) — — — 2,531,670(17)
(1) Each grant was approved on the approval date indicated above by our Compensation Committee or the Board, where applicable, for grant on
the specific grant date indicated above. For more information regarding our grant date policy, see “Equity Awards Grant Practices” in the
“Compensation Discussion and Analysis” above.
(2) The amounts shown represent the target and maximum amount of potential cash bonus plan awards provided for under the Electronic Arts
Executive Bonus Plan for Messrs. Jorgensen, Gibeau, Söderlund, Wilson and Barker. The target amounts are pre-established as a percentage
of salary and the maximum amounts represent the greatest payout that could have been made if the pre-established performance level was met
or exceeded. For more information regarding the bonuses paid to our NEOs in fiscal 2013 and an explanation of the amount of salary and
bonus in proportion to total compensation, see the sections titled “Compensation Principles and Structure”, “Individual NEO Compensation”,
and “Executive Bonus Plan” in the “Compensation Discussion and Analysis” above.
(3) Represents awards of RSUs with performance-based vesting granted under our 2000 Equity Incentive Plan. The performance-based RSUs
granted to our NEOs in fiscal 2013 are referred to as “Market-Based Restricted Stock Units” in Note 14, “Stock-Based Compensation and
Employee Benefit Plans”, to the Consolidated Financial Statements in our Annual Report on Form 10-K for the fiscal year ended March 31,
2013. The number of RSUs that vest will be based on EA’s total stockholder return (“TSR”) relative to the performance of those companies in
the NASDAQ-100 Index on April 1, 2012 (the “NASDAQ-100”). The TSR for the Company and the NASDAQ 100 will be measured over a
three year performance period covering fiscal years 2013 through 2015, with one year (fiscal 2013), two year (fiscal 2013 and 2014) and three
year (fiscal 2013, 2014 and 2015) TSR measurement periods. The TSR for each measurement period will be calculated using a 90-day trailing
average of the closing stock prices of the NASDAQ-100 at the end of each measurement period as compared to the 90-day average of the
49