Electronic Arts 2013 Annual Report Download - page 145
Download and view the complete annual report
Please find page 145 of the 2013 Electronic Arts annual report below. You can navigate through the pages in the report by either clicking on the pages listed below, or by using the keyword search tool below to find specific information within the annual report.-
 1
1 -
2
-
3
-
4
-
5
-
6
-
7
-
8
-
9
-
10
-
11
-
12
-
13
-
14
-
15
-
16
-
17
-
18
-
19
-
20
-
21
-
22
-
23
-
24
-
25
-
26
-
27
-
28
-
29
-
30
-
31
-
32
-
33
-
34
-
35
-
36
-
37
-
38
-
39
-
40
-
41
-
42
-
43
-
44
-
45
-
46
-
47
-
48
-
49
-
50
-
51
-
52
-
53
-
54
-
55
-
56
-
57
-
58
-
59
-
60
-
61
-
62
-
63
-
64
-
65
-
66
-
67
-
68
-
69
-
70
-
71
-
72
-
73
-
74
-
75
-
76
-
77
-
78
-
79
-
80
-
81
-
82
-
83
-
84
-
85
-
86
-
87
-
88
-
89
-
90
-
91
-
92
-
93
-
94
-
95
-
96
-
97
-
98
-
99
-
100
-
101
-
102
-
103
-
104
-
105
-
106
-
107
-
108
-
109
-
110
-
111
-
112
-
113
-
114
-
115
-
116
-
117
-
118
-
119
-
120
-
121
-
122
-
123
-
124
-
125
-
126
-
127
-
128
-
129
-
130
-
131
-
132
-
133
-
134
-
 135
135 -
 136
136 -
 137
137 -
 138
138 -
 139
139 -
 140
140 -
 141
141 -
 142
142 -
 143
143 -
 144
144 -
 145
145 -
 146
146 -
 147
147 -
 148
148 -
 149
149 -
 150
150 -
 151
151 -
 152
152 -
 153
153 -
 154
154 -
 155
155 -
156
-
157
-
158
-
159
-
160
-
161
-
162
-
163
-
164
-
165
-
166
-
167
-
168
-
169
-
170
-
171
-
172
-
173
-
174
-
175
-
176
-
177
-
178
-
179
-
180
-
181
-
182
-
183
-
184
-
185
-
186
-
187
-
188
-
189
-
190
-
191
-
192
-
193
-
194
-
195
-
196
-
197
-
198
-
199
-
200
-
201
-
202
-
203
-
204
 |
 |

Annual Report
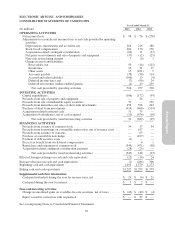
ELECTRONIC ARTS INC. AND SUBSIDIARIES
CONSOLIDATED BALANCE SHEETS
(In millions, except par value data) March 31,
2013
March 31,
2012
ASSETS
Current assets:
Cash and cash equivalents .................................................. $1,292 $1,293
Short-term investments .................................................... 388 437
Marketable equity securities ................................................ — 119
Receivables, net of allowances of $200 and $252, respectively ..................... 312 366
Inventories .............................................................. 42 59
Deferred income taxes, net ................................................. 52 67
Other current assets ....................................................... 239 268
Total current assets ..................................................... 2,325 2,609
Property and equipment, net .................................................. 548 568
Goodwill ................................................................. 1,721 1,718
Acquisition-related intangibles, net ............................................ 253 369
Deferred income taxes, net ................................................... 53 42
Other assets ............................................................... 170 185
TOTAL ASSETS ........................................................ $5,070 $5,491
LIABILITIES AND STOCKHOLDERS’ EQUITY
Current liabilities:
Accounts payable ........................................................ $ 136 $ 215
Accrued and other current liabilities .......................................... 737 857
Deferred net revenue (online-enabled games) .................................. 1,044 1,048
Total current liabilities .................................................. 1,917 2,120
0.75% convertible senior notes due 2016, net ..................................... 559 539
Income tax obligations ...................................................... 205 189
Deferred income taxes, net ................................................... 1 8
Other liabilities ............................................................ 121 177
Total liabilities ........................................................ 2,803 3,033
Commitments and contingencies (See Note 12)
Stockholders’ equity:
Preferred stock, $0.01 par value. 10 shares authorized ............................ — —
Common stock, $0.01 par value. 1,000 shares authorized; 302 and 320 shares issued and
outstanding, respectively ................................................. 3 3
Paid-in capital ........................................................... 2,174 2,359
Retained earnings (accumulated deficit) ....................................... 21 (77)
Accumulated other comprehensive income .................................... 69 173
Total stockholders’ equity ................................................ 2,267 2,458
TOTAL LIABILITIES AND STOCKHOLDERS’ EQUITY .................... $5,070 $5,491
See accompanying Notes to Consolidated Financial Statements.
61