Electronic Arts 2013 Annual Report Download - page 187
Download and view the complete annual report
Please find page 187 of the 2013 Electronic Arts annual report below. You can navigate through the pages in the report by either clicking on the pages listed below, or by using the keyword search tool below to find specific information within the annual report.-
 1
1 -
2
-
3
-
4
-
5
-
6
-
7
-
8
-
9
-
10
-
11
-
12
-
13
-
14
-
15
-
16
-
17
-
18
-
19
-
20
-
21
-
22
-
23
-
24
-
25
-
26
-
27
-
28
-
29
-
30
-
31
-
32
-
33
-
34
-
35
-
36
-
37
-
38
-
39
-
40
-
41
-
42
-
43
-
44
-
45
-
46
-
47
-
48
-
49
-
50
-
51
-
52
-
53
-
54
-
55
-
56
-
57
-
58
-
59
-
60
-
61
-
62
-
63
-
64
-
65
-
66
-
67
-
68
-
69
-
70
-
71
-
72
-
73
-
74
-
75
-
76
-
77
-
78
-
79
-
80
-
81
-
82
-
83
-
84
-
85
-
86
-
87
-
88
-
89
-
90
-
91
-
92
-
93
-
94
-
95
-
96
-
97
-
98
-
99
-
100
-
101
-
102
-
103
-
104
-
105
-
106
-
107
-
108
-
109
-
110
-
111
-
112
-
113
-
114
-
115
-
116
-
117
-
118
-
119
-
120
-
121
-
122
-
123
-
124
-
125
-
126
-
127
-
128
-
129
-
130
-
131
-
132
-
133
-
134
-
135
-
136
-
137
-
138
-
139
-
140
-
141
-
142
-
143
-
144
-
145
-
146
-
147
-
148
-
149
-
150
-
151
-
152
-
153
-
154
-
155
-
156
-
157
-
158
-
159
-
160
-
161
-
162
-
163
-
164
-
165
-
166
-
167
-
168
-
169
-
170
-
171
-
172
-
173
-
174
-
175
-
176
-
 177
177 -
 178
178 -
 179
179 -
 180
180 -
 181
181 -
 182
182 -
 183
183 -
 184
184 -
 185
185 -
 186
186 -
 187
187 -
 188
188 -
 189
189 -
 190
190 -
 191
191 -
 192
192 -
 193
193 -
 194
194 -
 195
195 -
 196
196 -
 197
197 -
198
-
199
-
200
-
201
-
202
-
203
-
204
 |
 |

Annual Report
(17) SEGMENT INFORMATION
Our reporting segment is based upon: our internal organizational structure; the manner in which our operations
are managed; the criteria used by our Executive Chairman, our Chief Operating Decision Maker (“CODM”), to
evaluate segment performance; the availability of separate financial information; and overall materiality
considerations.
Our business is currently organized around our five labels, EA Games, EA SPORTS, Maxis, PopCap and All
Play. During the year ended March 31, 2013, we renamed our Social/Mobile studios to All Play and integrated
the social and mobile studios of our BioWare label into our All Play organization while the remaining studios of
our BioWare label were integrated into our EA Games label. Our CODM regularly reviews the aggregated results
of the five labels to assess overall performance and allocate resources. All five of the labels comprise our
operating segment (the “EA Labels” segment) as shown below. To a lesser degree, our CODM also reviews
results based on geographic performance.
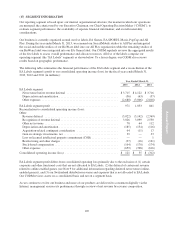
The following table summarizes the financial performance of the EA Labels segment and a reconciliation of the
EA Labels segment’s profit to our consolidated operating income (loss) for the fiscal years ended March 31,
2013, 2012 and 2011 (in millions):
Year Ended March 31,
2013 2012 2011
EA Labels segment:
Net revenue before revenue deferral ................................... $3,715 $ 4,122 $ 3,716
Depreciation and amortization ........................................ (56) (63) (57)
Other expenses .................................................... (2,688) (3,006) (2,818)
EA Labels segment profit .............................................. 971 1,053 841
Reconciliation to consolidated operating income (loss):
Other:
Revenue deferral .................................................. (3,022) (3,142) (2,769)
Recognition of revenue deferral ....................................... 3,026 3,099 2,530
Other net revenue .................................................. 78 64 112
Depreciation and amortization ........................................ (185) (134) (116)
Acquisition-related contingent consideration ............................ 64 (11) 17
Gain on strategic investments, net ..................................... 39 — 23
Loss on licensed intellectual property commitment (COR) .................. — — 1
Restructuring and other charges ....................................... (27) (16) (161)
Stock-based compensation ........................................... (164) (170) (174)
Other expenses .................................................... (659) (708) (616)
Consolidated operating income (loss) .................................... $ 121 $ 35 $ (312)
EA Labels segment profit differs from consolidated operating loss primarily due to the exclusion of (1) certain
corporate and other functional costs that are not allocated to EA Labels, (2) the deferral of certain net revenue
related to online-enabled games (see Note 9 for additional information regarding deferred net revenue (online-
enabled games)), and (3) our Switzerland distribution revenue and expenses that is not allocated to EA Labels.
Our CODM reviews assets on a consolidated basis and not on a segment basis.
As we continue to evolve our business and more of our products are delivered to consumers digitally via the
Internet, management assesses its performance through a review of net revenue by revenue composition.
103