Electronic Arts 2013 Annual Report Download - page 132
Download and view the complete annual report
Please find page 132 of the 2013 Electronic Arts annual report below. You can navigate through the pages in the report by either clicking on the pages listed below, or by using the keyword search tool below to find specific information within the annual report.-
 1
1 -
2
-
3
-
4
-
5
-
6
-
7
-
8
-
9
-
10
-
11
-
12
-
13
-
14
-
15
-
16
-
17
-
18
-
19
-
20
-
21
-
22
-
23
-
24
-
25
-
26
-
27
-
28
-
29
-
30
-
31
-
32
-
33
-
34
-
35
-
36
-
37
-
38
-
39
-
40
-
41
-
42
-
43
-
44
-
45
-
46
-
47
-
48
-
49
-
50
-
51
-
52
-
53
-
54
-
55
-
56
-
57
-
58
-
59
-
60
-
61
-
62
-
63
-
64
-
65
-
66
-
67
-
68
-
69
-
70
-
71
-
72
-
73
-
74
-
75
-
76
-
77
-
78
-
79
-
80
-
81
-
82
-
83
-
84
-
85
-
86
-
87
-
88
-
89
-
90
-
91
-
92
-
93
-
94
-
95
-
96
-
97
-
98
-
99
-
100
-
101
-
102
-
103
-
104
-
105
-
106
-
107
-
108
-
109
-
110
-
111
-
112
-
113
-
114
-
115
-
116
-
117
-
118
-
119
-
120
-
121
-
 122
122 -
 123
123 -
 124
124 -
 125
125 -
 126
126 -
 127
127 -
 128
128 -
 129
129 -
 130
130 -
 131
131 -
 132
132 -
 133
133 -
 134
134 -
 135
135 -
 136
136 -
 137
137 -
 138
138 -
 139
139 -
 140
140 -
 141
141 -
 142
142 -
143
-
144
-
145
-
146
-
147
-
148
-
149
-
150
-
151
-
152
-
153
-
154
-
155
-
156
-
157
-
158
-
159
-
160
-
161
-
162
-
163
-
164
-
165
-
166
-
167
-
168
-
169
-
170
-
171
-
172
-
173
-
174
-
175
-
176
-
177
-
178
-
179
-
180
-
181
-
182
-
183
-
184
-
185
-
186
-
187
-
188
-
189
-
190
-
191
-
192
-
193
-
194
-
195
-
196
-
197
-
198
-
199
-
200
-
201
-
202
-
203
-
204
 |
 |

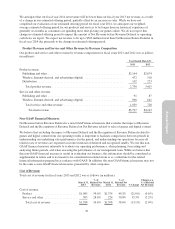
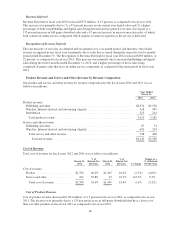
General and Administrative
General and administrative expenses for fiscal years 2012 and 2011 were as follows (in millions):
March 31,
2012
% of Net
Revenue
March 31,
2011
% of Net
Revenue $ Change % Change
$377 9% $296 8% $81 27%
General and administrative expenses increased by $81 million, or 27 percent, in fiscal year 2012, as compared to
fiscal year 2011. The increase was primarily due to (1) a $35 million increase in contracted service costs related
to online initiatives, litigation, and recent acquisitions, (2) a $27 million accrual related to a potential settlement
of an on-going litigation matter, (3) a $17 million increase in additional personnel-related costs resulting from an
increase in headcount in connection with recent acquisitions, and (4) a $13 million increase in bad debt expense.
These increases were partially offset by a $14 million decrease in facility overhead costs.
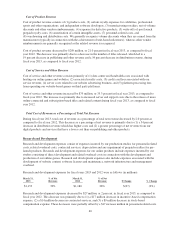
Acquisition-Related Contingent Consideration
Acquisition-related contingent consideration for fiscal years 2012 and 2011 were as follows (in millions):
March 31,
2012
% of Net
Revenue
March 31,
2011
% of Net
Revenue $ Change % Change
$11 —% $(17) —% $28 165%
Acquisition-related contingent consideration expense increased by $28 million, or 165 percent, in fiscal year
2012, as compared to fiscal year 2011, primarily related to (1) a $19 million prior year decrease of our accrual in
connection with our Playfish acquisition resulting from revisions in our estimate of the expected future cash
flows over the period in which the obligation was expected to be settled with no comparable revision to decrease
the accrual in fiscal year 2012 and (2) a contributing increase of $9 million resulting from contingent
consideration from other acquisitions in the current year.
Amortization of Intangibles
Amortization of intangibles for fiscal years 2012 and 2011 were as follows (in millions):
March 31,
2012
% of Net
Revenue
March 31,
2011
% of Net
Revenue $ Change % Change
$43 1% $57 2% $(14) (25%)
Amortization of intangibles decreased by $14 million, or 25 percent, in fiscal year 2012, as compared to fiscal
year 2011. This decrease was primarily due to certain intangible assets from our prior year acquisitions being
fully amortized during the fiscal year 2012.
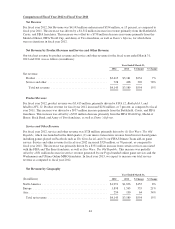
Restructuring and Other Charges
Restructuring and other charges for fiscal years 2012 and 2011 were as follows (in millions):
March 31,
2012
% of Net
Revenue
March 31,
2011
% of Net
Revenue $ Change % Change
$16 —% $161 4% $(145) (90%)
Restructuring and other charges decreased by $145 million, or 90 percent, in fiscal year 2012, as compared to
fiscal year 2011, due to (1) no new restructuring initiatives in fiscal year 2012 and (2) a gain of $10 million
recognized during the second quarter of fiscal year 2012 on the sale of our facility in Chertsey, England related to
our fiscal year 2008 reorganization. These items are partially offset by adjustments to the estimated loss for the
amendment of certain licensing agreements related to our fiscal 2011 restructuring.
48