Electronic Arts 2013 Annual Report Download - page 47
Download and view the complete annual report
Please find page 47 of the 2013 Electronic Arts annual report below. You can navigate through the pages in the report by either clicking on the pages listed below, or by using the keyword search tool below to find specific information within the annual report.-
 1
1 -
2
-
3
-
4
-
5
-
6
-
7
-
8
-
9
-
10
-
11
-
12
-
13
-
14
-
15
-
16
-
17
-
18
-
19
-
20
-
21
-
22
-
23
-
24
-
25
-
26
-
27
-
28
-
29
-
30
-
31
-
32
-
33
-
34
-
35
-
36
-
 37
37 -
 38
38 -
 39
39 -
 40
40 -
 41
41 -
 42
42 -
 43
43 -
 44
44 -
 45
45 -
 46
46 -
 47
47 -
 48
48 -
 49
49 -
 50
50 -
 51
51 -
 52
52 -
 53
53 -
 54
54 -
 55
55 -
 56
56 -
 57
57 -
58
-
59
-
60
-
61
-
62
-
63
-
64
-
65
-
66
-
67
-
68
-
69
-
70
-
71
-
72
-
73
-
74
-
75
-
76
-
77
-
78
-
79
-
80
-
81
-
82
-
83
-
84
-
85
-
86
-
87
-
88
-
89
-
90
-
91
-
92
-
93
-
94
-
95
-
96
-
97
-
98
-
99
-
100
-
101
-
102
-
103
-
104
-
105
-
106
-
107
-
108
-
109
-
110
-
111
-
112
-
113
-
114
-
115
-
116
-
117
-
118
-
119
-
120
-
121
-
122
-
123
-
124
-
125
-
126
-
127
-
128
-
129
-
130
-
131
-
132
-
133
-
134
-
135
-
136
-
137
-
138
-
139
-
140
-
141
-
142
-
143
-
144
-
145
-
146
-
147
-
148
-
149
-
150
-
151
-
152
-
153
-
154
-
155
-
156
-
157
-
158
-
159
-
160
-
161
-
162
-
163
-
164
-
165
-
166
-
167
-
168
-
169
-
170
-
171
-
172
-
173
-
174
-
175
-
176
-
177
-
178
-
179
-
180
-
181
-
182
-
183
-
184
-
185
-
186
-
187
-
188
-
189
-
190
-
191
-
192
-
193
-
194
-
195
-
196
-
197
-
198
-
199
-
200
-
201
-
202
-
203
-
204
 |
 |

Proxy Statement
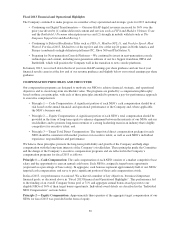
The below table shows the objectives and weighting that were established for Mr. Riccitiello’s fiscal 2013 bonus.
Mr. Riccitiello resigned from the Company effective March 29, 2013 and therefore, did not receive a cash bonus
for fiscal 2013.
Weighting
Non-GAAP Earnings Per Share 30%
Non-GAAP Net Revenue 20%
Non-GAAP Digital Revenue 15%
Pop Cap Non-GAAP Revenue 5%
Pop Cap Profitability 5%
Individual Performance: Franchise Growth, Development of Intellectual Property,
Organization Health, Digital Transformation, and Next-Generation Console Preparation 25%
Total 100%
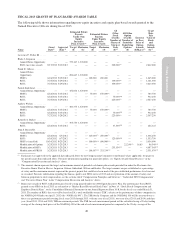
Equity Awards: In June 2012, the Board of Directors granted Mr. Riccitiello performance-based RSUs with a
target vesting of 125,000 shares and 125,000 time-based RSUs. In October 2012, the Board of Directors granted
Mr. Riccitiello a supplemental performance-based RSU award with a target vesting of 300,000 shares. In making
these awards, the Board evaluated multiple factors, including driving alignment with Company performance,
retention, the impact of annual pro-rata and longer-term vesting, and the target value of the award. The
cumulative value of the equity awards granted to Mr. Riccitiello in June 2012 and October 2012 was below the
50th percentile of the market. The full grant date fair value of these awards is included in the “Fiscal 2013
Summary Compensation Table”; however, the supplemental performance-based RSU award was cancelled in full
upon Mr. Riccitiello’s termination of employment, and the performance-based RSU and RSU awards granted in
June 2012 were modified to allow for continued vesting only through June 19, 2014, in accordance with their
terms and as if Mr. Riccitiello had remained employed by the Company through such date.
COMPENSATION PROGRAMS AND PLANS
Non-GAAP Financial Measures
The Company uses certain adjusted non-GAAP financial measures when establishing performance-based bonus
and equity award targets, such as non-GAAP diluted earnings per share, non-GAAP net revenue, non-GAAP net
income, non-GAAP profit before tax, and non-GAAP digital revenue. These non-GAAP financial measures
exclude the following items (as applicable, in a given reporting period): acquisition-related expenses, changes in
deferred net revenue (online-enabled games), losses (gains) on strategic investments, amortization of debt
discount, restructuring charges, stock-based compensation and income tax adjustments, among others. In
addition, for these purposes, we make further adjustments to our publicly disclosed non-GAAP measures to add
back bonus expense.
Base Salary
A competitive base salary is a crucial component in providing an attractive total compensation package for our
NEOs. The Committee initially sets each NEO’s base salary at a level, which reflects the NEO’s position,
responsibilities and experience, as compared to similar executives at comparable companies. On an annual basis,
the Committee reviews and approves any base salary adjustments, considering such factors as individual
performance, pay relative to market, level of responsibilities, complexity of role, and internal compensation
alignment.
As part of its May 2013 compensation review, the Committee approved the base salary increases ranging from
approximately 2% to 5% for our current NEOs, other than Mr. Probst. Effective June 1, 2013, our NEO’s salaries
will be: Mr. Probst, $1,030,000; Mr. Gibeau $725,000; Mr. Jorgensen, $670,000; Mr. Söderlund $635,000;
Mr. Wilson, $550,000; Mr. Barker $458,350. These increases were consistent with the compensation-setting
process described above.
39