Electronic Arts 2013 Annual Report Download - page 60
Download and view the complete annual report
Please find page 60 of the 2013 Electronic Arts annual report below. You can navigate through the pages in the report by either clicking on the pages listed below, or by using the keyword search tool below to find specific information within the annual report.-
 1
1 -
2
-
3
-
4
-
5
-
6
-
7
-
8
-
9
-
10
-
11
-
12
-
13
-
14
-
15
-
16
-
17
-
18
-
19
-
20
-
21
-
22
-
23
-
24
-
25
-
26
-
27
-
28
-
29
-
30
-
31
-
32
-
33
-
34
-
35
-
36
-
37
-
38
-
39
-
40
-
41
-
42
-
43
-
44
-
45
-
46
-
47
-
48
-
49
-
 50
50 -
 51
51 -
 52
52 -
 53
53 -
 54
54 -
 55
55 -
 56
56 -
 57
57 -
 58
58 -
 59
59 -
 60
60 -
 61
61 -
 62
62 -
 63
63 -
 64
64 -
 65
65 -
 66
66 -
 67
67 -
 68
68 -
 69
69 -
 70
70 -
71
-
72
-
73
-
74
-
75
-
76
-
77
-
78
-
79
-
80
-
81
-
82
-
83
-
84
-
85
-
86
-
87
-
88
-
89
-
90
-
91
-
92
-
93
-
94
-
95
-
96
-
97
-
98
-
99
-
100
-
101
-
102
-
103
-
104
-
105
-
106
-
107
-
108
-
109
-
110
-
111
-
112
-
113
-
114
-
115
-
116
-
117
-
118
-
119
-
120
-
121
-
122
-
123
-
124
-
125
-
126
-
127
-
128
-
129
-
130
-
131
-
132
-
133
-
134
-
135
-
136
-
137
-
138
-
139
-
140
-
141
-
142
-
143
-
144
-
145
-
146
-
147
-
148
-
149
-
150
-
151
-
152
-
153
-
154
-
155
-
156
-
157
-
158
-
159
-
160
-
161
-
162
-
163
-
164
-
165
-
166
-
167
-
168
-
169
-
170
-
171
-
172
-
173
-
174
-
175
-
176
-
177
-
178
-
179
-
180
-
181
-
182
-
183
-
184
-
185
-
186
-
187
-
188
-
189
-
190
-
191
-
192
-
193
-
194
-
195
-
196
-
197
-
198
-
199
-
200
-
201
-
202
-
203
-
204
 |
 |

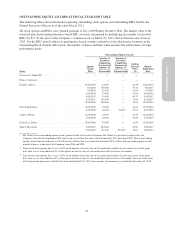
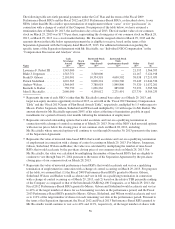
Outstanding Stock Awards
Time-Based Vesting
Awards
Performance-Based Vesting
Awards
Name
Grant
Date
Number of
Shares or
Units of
Stock
That Have
Not
Vested
(#)
Market
Value of
Shares
or Units
of Stock
That
Have
Not
Vested
($)
Equity
Incentive
Plan
Awards:
Number of
Unearned
Shares, Units
or Other
Rights That
Have Not
Vested
(#)
Equity
Incentive
Plan Awards:
Market or
Payout Value
of Unearned
Shares, Units
or Other
Rights That
Have Not
Vested ($)
Lawrence F. Probst(1) ................................. — — — — —
Blake J. Jorgensen .................................... 9/17/2012 200,000(2) 3,540,000 — —
Frank D. Gibeau ..................................... 5/16/2008 — — 125,000(3) 2,212,500
6/16/2011 — — 66,667(4) 1,180,006
6/18/2012 — — 100,000(5) 1,770,000
5/17/2010 43,334(6) 767,012 — —
6/16/2011 66,667(7) 1,180,006 — —
2/16/2012 75,000(8) 1,327,500 — —
7/27/2012 300,000(9) 5,310,000 — —
7/27/2012 100,000(10) 1,770,000 — —
Patrick Söderlund .................................... 5/16/2008 — — 60,000(3) 1,062,000
6/16/2011 — — 50,000(4) 885,000
6/18/2012 — — 75,000(5) 1,327,500
8/17/2009 5,775(2) 102,218 — —
5/17/2010 30,000(6) 531,000 — —
12/16/2010 16,667(6) 295,006 — —
6/16/2011 50,000(7) 885,000 — —
2/16/2012 50,000(6) 885,000 — —
6/18/2012 75,000(8) 1,327,500 — —
7/27/2012 225,000(9) 3,982,500 — —
Andrew Wilson ...................................... 9/16/2009 — — 20,000(3) 354,000
6/18/2012 — — 75,000(5) 1,327,500
5/17/2010 23,334(6) 413,012 — —
6/16/2011 66,667(7) 1,180,006 — —
2/16/2012 50,000(8) 885,000 — —
6/18/2012 75,000(7) 1,327,500 — —
7/27/2012 225,000(9) 3,982,500 — —
Kenneth A. Barker ................................... 5/16/2008 — — 50,000(3) 885,000
5/17/2010 13,334(6) 236,012 — —
6/16/2011 25,000(7) 442,500 — —
2/16/2012 20,000(8) 354,000 — —
6/18/2012 37,500(7) 663,750 — —
John S. Riccitiello .................................... 5/16/2008 — — 200,000(3) 3,540,000
6/16/2011 — — 83,333(4)(11) 1,474,994
6/18/2012 — — 83,333(5)(11) 1,474,994
5/18/2010 66,667(6)(12) 1,180,006 — —
6/16/2011 83,334(7)(12) 1,475,012 — —
6/18/2012 83,333(7)(12) 1,474,994 — —
(1) Mr. Probst was granted 10,000 RSUs on July 26, 2012 for his services as a director for fiscal 2013, as reported in the “Stock Awards”
column of the “Fiscal 2013 Director Compensation Table” above. These RSUs will vest in their entirety on July 26, 2013.
(2) Time-based RSUs with one-fourth of the units vesting on each of the first four anniversaries of the grant date.
(3) Represents RSUs with performance-based vesting at the threshold target achievement level of one-third of the RSU award granted. The
awards may vest in three equal amounts with the vesting of each amount contingent upon EA’s achievement of three progressively higher
adjusted non-GAAP net income targets (as measured on a trailing four-quarter basis). On the grant date, we assumed that one-third of the
awards would vest based upon achievement of the first non-GAAP net income target. During the fiscal year ended March 31, 2013, we
determined that the performance criteria for these awards was improbable of achievement. For additional information, see Note 14,
52