Electronic Arts 2013 Annual Report Download - page 131
Download and view the complete annual report
Please find page 131 of the 2013 Electronic Arts annual report below. You can navigate through the pages in the report by either clicking on the pages listed below, or by using the keyword search tool below to find specific information within the annual report.-
 1
1 -
2
-
3
-
4
-
5
-
6
-
7
-
8
-
9
-
10
-
11
-
12
-
13
-
14
-
15
-
16
-
17
-
18
-
19
-
20
-
21
-
22
-
23
-
24
-
25
-
26
-
27
-
28
-
29
-
30
-
31
-
32
-
33
-
34
-
35
-
36
-
37
-
38
-
39
-
40
-
41
-
42
-
43
-
44
-
45
-
46
-
47
-
48
-
49
-
50
-
51
-
52
-
53
-
54
-
55
-
56
-
57
-
58
-
59
-
60
-
61
-
62
-
63
-
64
-
65
-
66
-
67
-
68
-
69
-
70
-
71
-
72
-
73
-
74
-
75
-
76
-
77
-
78
-
79
-
80
-
81
-
82
-
83
-
84
-
85
-
86
-
87
-
88
-
89
-
90
-
91
-
92
-
93
-
94
-
95
-
96
-
97
-
98
-
99
-
100
-
101
-
102
-
103
-
104
-
105
-
106
-
107
-
108
-
109
-
110
-
111
-
112
-
113
-
114
-
115
-
116
-
117
-
118
-
119
-
120
-
 121
121 -
 122
122 -
 123
123 -
 124
124 -
 125
125 -
 126
126 -
 127
127 -
 128
128 -
 129
129 -
 130
130 -
 131
131 -
 132
132 -
 133
133 -
 134
134 -
 135
135 -
 136
136 -
 137
137 -
 138
138 -
 139
139 -
 140
140 -
 141
141 -
142
-
143
-
144
-
145
-
146
-
147
-
148
-
149
-
150
-
151
-
152
-
153
-
154
-
155
-
156
-
157
-
158
-
159
-
160
-
161
-
162
-
163
-
164
-
165
-
166
-
167
-
168
-
169
-
170
-
171
-
172
-
173
-
174
-
175
-
176
-
177
-
178
-
179
-
180
-
181
-
182
-
183
-
184
-
185
-
186
-
187
-
188
-
189
-
190
-
191
-
192
-
193
-
194
-
195
-
196
-
197
-
198
-
199
-
200
-
201
-
202
-
203
-
204
 |
 |

Annual Report
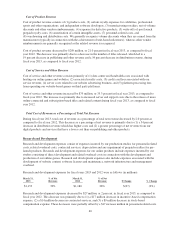
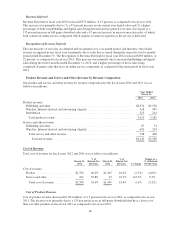
Cost of Service and Other Revenue
Cost of service and other revenue increased by $132 million, or 143.5 percent in fiscal year 2012, as compared to
fiscal year 2011. The increase was primarily due to increased server and support costs due to the release of more
online-connected and subscription-based titles and related content during fiscal year 2012 as compared to fiscal
year 2011. As our service revenue in fiscal year 2013 is expected to increase as compared to fiscal year 2012, we
expect a corresponding increase in our service and support costs.
Total Cost of Revenue as a Percentage of Total Net Revenue
During fiscal year 2012, total cost of revenue as a percentage of total net revenue decreased by 3.2 percent as
compared to fiscal year 2011. This decrease as a percentage of net revenue was primarily due to (1) a greater
percentage of net revenue from our digital products, that have a lower cost than our other products, which
positively impacted gross profit as a percentage of total revenue by approximately 3.5 percent and (2) a
$196 million decrease in the change in deferred net revenue related to certain online-enabled games for fiscal
year 2012 as compared to fiscal year 2011, which positively impacted gross profit as a percent of total net
revenue by 2.2 percent. These decreases are partially offset by (1) increased expenses related to our online and
customer experience initiatives, which negatively impacted gross profit as a percentage of total net revenue by
1.2 percent, (2) an increase in amortization of our acquisition-related intangibles resulting mainly from the
PopCap acquisition in fiscal year 2012, which negatively impacted gross profit as a percentage of total net
revenue by 0.9 percent, and (3) an increase in sales of our distribution products which carry a higher royalty
percentage than our other products, which negatively impacted gross profit as a percentage of total net revenue
by 0.9 percent.
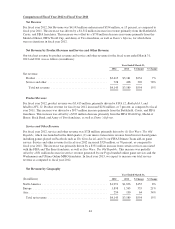
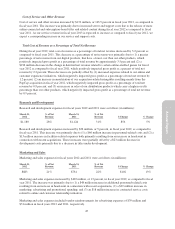
Research and Development
Research and development expenses for fiscal years 2012 and 2011 were as follows (in millions):
March 31,
2012
% of Net
Revenue
March 31,
2011
% of Net
Revenue $ Change % Change
$1,180 28% $1,124 31% $56 5%
Research and development expenses increased by $56 million, or 5 percent, in fiscal year 2012, as compared to
fiscal year 2011. This increase was primarily due to (1) a $66 million increase in personnel-related costs and (2) a
$13 million increase in facilities-related expenses both primarily resulting from an increase in headcount in
connection with recent acquisitions. These increases were partially offset by a $23 million decrease in
development costs primarily due to a decrease in titles under development.
Marketing and Sales
Marketing and sales expenses for fiscal years 2012 and 2011 were as follows (in millions):
March 31,
2012
% of Net
Revenue
March 31,
2011
% of Net
Revenue $ Change % Change
$883 21% $781 22% $102 13%
Marketing and sales expenses increased by $102 million, or 13 percent, in fiscal year 2012, as compared to fiscal
year 2011. The increase was primarily due to (1) a $48 million increase in additional personnel-related costs
resulting from an increase in headcount in connection with recent acquisitions, (2) a $29 million increase in
marketing, advertising and promotional spending, and (3) an $18 million increase in contracted service costs
related to online and customer relationship initiatives.
Marketing and sales expenses included vendor reimbursements for advertising expenses of $39 million and
$31 million in fiscal years 2012 and 2011, respectively.
47