Electronic Arts 2013 Annual Report Download - page 129
Download and view the complete annual report
Please find page 129 of the 2013 Electronic Arts annual report below. You can navigate through the pages in the report by either clicking on the pages listed below, or by using the keyword search tool below to find specific information within the annual report.-
 1
1 -
2
-
3
-
4
-
5
-
6
-
7
-
8
-
9
-
10
-
11
-
12
-
13
-
14
-
15
-
16
-
17
-
18
-
19
-
20
-
21
-
22
-
23
-
24
-
25
-
26
-
27
-
28
-
29
-
30
-
31
-
32
-
33
-
34
-
35
-
36
-
37
-
38
-
39
-
40
-
41
-
42
-
43
-
44
-
45
-
46
-
47
-
48
-
49
-
50
-
51
-
52
-
53
-
54
-
55
-
56
-
57
-
58
-
59
-
60
-
61
-
62
-
63
-
64
-
65
-
66
-
67
-
68
-
69
-
70
-
71
-
72
-
73
-
74
-
75
-
76
-
77
-
78
-
79
-
80
-
81
-
82
-
83
-
84
-
85
-
86
-
87
-
88
-
89
-
90
-
91
-
92
-
93
-
94
-
95
-
96
-
97
-
98
-
99
-
100
-
101
-
102
-
103
-
104
-
105
-
106
-
107
-
108
-
109
-
110
-
111
-
112
-
113
-
114
-
115
-
116
-
117
-
118
-
 119
119 -
 120
120 -
 121
121 -
 122
122 -
 123
123 -
 124
124 -
 125
125 -
 126
126 -
 127
127 -
 128
128 -
 129
129 -
 130
130 -
 131
131 -
 132
132 -
 133
133 -
 134
134 -
 135
135 -
 136
136 -
 137
137 -
 138
138 -
 139
139 -
140
-
141
-
142
-
143
-
144
-
145
-
146
-
147
-
148
-
149
-
150
-
151
-
152
-
153
-
154
-
155
-
156
-
157
-
158
-
159
-
160
-
161
-
162
-
163
-
164
-
165
-
166
-
167
-
168
-
169
-
170
-
171
-
172
-
173
-
174
-
175
-
176
-
177
-
178
-
179
-
180
-
181
-
182
-
183
-
184
-
185
-
186
-
187
-
188
-
189
-
190
-
191
-
192
-
193
-
194
-
195
-
196
-
197
-
198
-
199
-
200
-
201
-
202
-
203
-
204
 |
 |

Annual Report
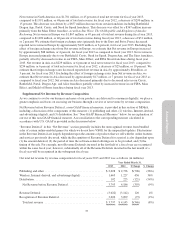
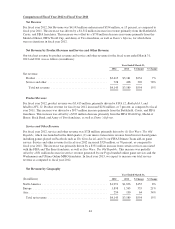
Net revenue in North America was $1,991 million, or 48 percent of total net revenue for fiscal year 2012,
compared to $1,836 million, or 51 percent of total net revenue for fiscal year 2011, an increase of $155 million,
or 8 percent. Net revenue in Europe and Asia was $2,152 million, or 52 percent of total net revenue for fiscal
year 2012, compared to $1,753 million, or 49 percent of total net revenue for fiscal year 2011, an increase of
$399 million, or 23 percent. The rapid increase in revenue outside of North America was primarily the result of
increased sales from our FIFA, Battlefield, and Crysis franchises in Europe. Additionally, the value of the U.S.
dollar relative to foreign currencies contributed to an increase of total reported net revenue of approximately
$143 million (primarily the Swiss Franc and Australian Dollar), or 3 percent of total net revenue.
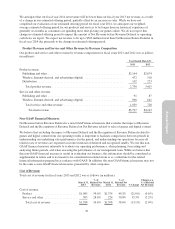
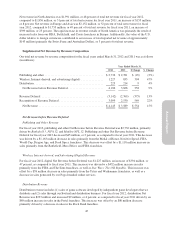
Supplemental Net Revenue by Revenue Composition
Our total net revenue by revenue composition for the fiscal years ended March 31, 2012 and 2011 was as follows
(in millions):
Year Ended March 31,
2012 2011 $ Change % Change
Publishing and other ........................................ $2,736 $ 2,781 $ (45) (2%)
Wireless, Internet-derived, and advertising (digital) ............... 1,227 833 394 47%
Distribution ............................................... 223 214 9 4%
Net Revenue before Revenue Deferral ........................ 4,186 3,828 358 9%
Revenue Deferral .......................................... (3,142) (2,769) (373) 13%
Recognition of Revenue Deferral .............................. 3,099 2,530 569 22%
Net Revenue ............................................ $4,143 $ 3,589 $ 554 15%
Net Revenue before Revenue Deferral
Publishing and Other Revenue
For fiscal year 2012, publishing and other Net Revenue before Revenue Deferral was $2,736 million, primarily
driven by Battlefield 3, FIFA 12, and Madden NFL 12. Publishing and other Net Revenue before Revenue
Deferral for fiscal year 2012 decreased $45 million, or 2 percent, as compared to fiscal year 2011. This decrease
was driven by a $1,163 million decrease in sales primarily from the Medal of Honor, Need for Speed, FIFA
World Cup, Dragon Age, and Dead Space franchises. This decrease was offset by a $1,118 million increase in
sales primarily from the Battlefield, Mass Effect, and FIFA franchises.
Wireless, Internet-derived, and Advertising (Digital) Revenue
For fiscal year 2012, digital Net Revenue before Deferral was $1,227 million, an increase of $394 million, or
47 percent, as compared to fiscal year 2011. This increase was driven by a $452 million increase in sales
primarily from the FIFA and The Sims franchises, as well as Star Wars: The Old Republic. This increase was
offset by a $58 million decrease in sales primarily from the Tetris and Warhammer franchises, as well as a
decrease in sales generated by our Pogo-branded online services.
Distribution Revenue
Distribution revenue includes (1) sales of game software developed by independent game developers that we
distribute and (2) sales through our Switzerland distribution business. For fiscal year 2012, distribution Net
Revenue was $223 million and increased $9 million, or 4 percent, as compared to fiscal year 2011 driven by an
$89 million increase in sales in the Portal franchise. This increase was offset by an $80 million decrease
primarily driven by a decrease in sales in the Rock Band franchise.
45