Facebook 2013 Annual Report Download - page 35
Download and view the complete annual report
Please find page 35 of the 2013 Facebook annual report below. You can navigate through the pages in the report by either clicking on the pages listed below, or by using the keyword search tool below to find specific information within the annual report.-
 1
1 -
2
-
3
-
4
-
5
-
6
-
7
-
8
-
9
-
10
-
11
-
12
-
13
-
14
-
15
-
16
-
17
-
18
-
19
-
20
-
21
-
22
-
23
-
24
-
 25
25 -
 26
26 -
 27
27 -
 28
28 -
 29
29 -
 30
30 -
 31
31 -
 32
32 -
 33
33 -
 34
34 -
 35
35 -
 36
36 -
 37
37 -
 38
38 -
 39
39 -
 40
40 -
 41
41 -
 42
42 -
 43
43 -
 44
44 -
 45
45 -
46
-
47
-
48
-
49
-
50
-
51
-
52
-
53
-
54
-
55
-
56
-
57
-
58
-
59
-
60
-
61
-
62
-
63
-
64
-
65
-
66
-
67
-
68
-
69
-
70
-
71
-
72
-
73
-
74
-
75
-
76
-
77
-
78
-
79
-
80
-
81
-
82
-
83
-
84
-
85
-
86
-
87
-
88
-
89
-
90
-
91
-
92
-
93
-
94
-
95
-
96
 |
 |
33
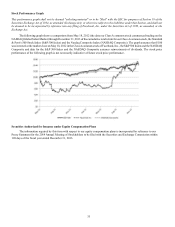
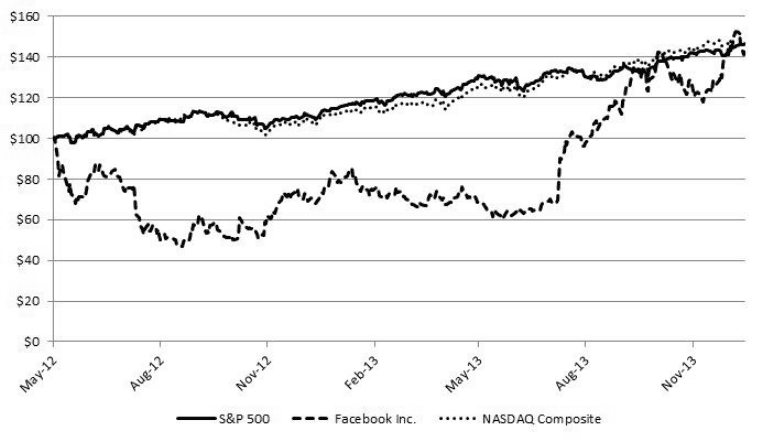
Stock Performance Graph
This performance graph shall not be deemed "soliciting material" or to be "filed" with the SEC for purposes of Section 18 of the
Securities Exchange Act of 1934, as amended (Exchange Act), or otherwise subject to the liabilities under that Section, and shall not
be deemed to be incorporated by reference into any filing of Facebook, Inc. under the Securities Act of 1933, as amended, or the
Exchange Act.
The following graph shows a comparison from May 18, 2012 (the date our Class A common stock commenced trading on the
NASDAQ Global Select Market) through December 31, 2013 of the cumulative total return for our Class A common stock, the Standard
& Poor's 500 Stock Index (S&P 500 Index) and the Nasdaq Composite Index (NASDAQ Composite). The graph assumes that $100
was invested at the market close on May 18, 2012 in the Class A common stock of Facebook, Inc., the S&P 500 Index and the NASDAQ
Composite and data for the S&P 500 Index and the NASDAQ Composite assumes reinvestments of dividends. The stock price
performance of the following graph is not necessarily indicative of future stock price performance.
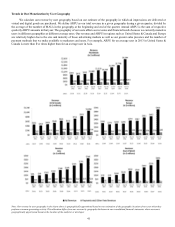
Securities Authorized for Issuance under Equity Compensation Plans
The information required by this item with respect to our equity compensation plans is incorporated by reference to our
Proxy Statement for the 2014 Annual Meeting of Stockholders to be filed with the Securities and Exchange Commission within
120 days of the fiscal year ended December 31, 2013.