Facebook 2013 Annual Report Download - page 56
Download and view the complete annual report
Please find page 56 of the 2013 Facebook annual report below. You can navigate through the pages in the report by either clicking on the pages listed below, or by using the keyword search tool below to find specific information within the annual report.-
 1
1 -
2
-
3
-
4
-
5
-
6
-
7
-
8
-
9
-
10
-
11
-
12
-
13
-
14
-
15
-
16
-
17
-
18
-
19
-
20
-
21
-
22
-
23
-
24
-
25
-
26
-
27
-
28
-
29
-
30
-
31
-
32
-
33
-
34
-
35
-
36
-
37
-
38
-
39
-
40
-
41
-
42
-
43
-
44
-
45
-
 46
46 -
 47
47 -
 48
48 -
 49
49 -
 50
50 -
 51
51 -
 52
52 -
 53
53 -
 54
54 -
 55
55 -
 56
56 -
 57
57 -
 58
58 -
 59
59 -
 60
60 -
 61
61 -
 62
62 -
 63
63 -
 64
64 -
 65
65 -
 66
66 -
67
-
68
-
69
-
70
-
71
-
72
-
73
-
74
-
75
-
76
-
77
-
78
-
79
-
80
-
81
-
82
-
83
-
84
-
85
-
86
-
87
-
88
-
89
-
90
-
91
-
92
-
93
-
94
-
95
-
96
 |
 |
54
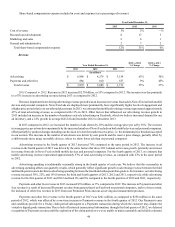
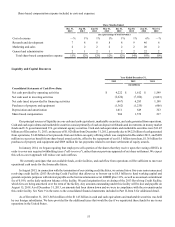
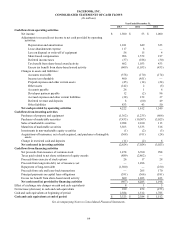
Cash Provided by Operating Activities
Cash flow from operating activities during 2013 primarily consisted of net income, adjusted for certain non-cash items, including
depreciation and amortization of $1.01 billion and share-based compensation expense of $906 million, and an increase in other
liabilities related to uncertain tax positions. The cash flow from operating activities during 2013 compared to 2012 increased mainly
due to an increase in net income of $1.45 billion and uncertain tax position of $786 million. In addition, we received income tax
refunds of $421 million in 2013.
Cash flow from operating activities during 2012 primarily consisted of adjustments to net income for certain non-cash items
such as share-based compensation expense of $1.57 billion and depreciation and amortization of $649 million, partially offset by
income tax refundable of $451 million. The cash flow from operating activities during 2012 compared to 2011 increased modestly
as the increases in adjustments for non-cash items as described above were offset by a reduction in net income of $947 million and
an increase in income tax refundable.
Cash flow from operating activities during 2011 primarily consisted of net income, adjusted for certain non-cash items, including
depreciation and amortization of $323 million and share-based compensation expense of $217 million.
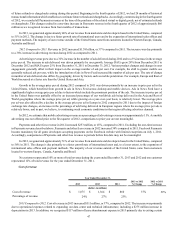
Cash Used in Investing Activities
Cash used in investing activities during 2013 primarily resulted from $1.36 billion for capital expenditures related to the purchase
of servers, network infrastructure, and the construction of data centers, as well as $882 million for the net purchase of marketable
securities and $368 million for the acquisition of businesses and other assets, such as patents. The decrease in cash used in investing
activities during 2013 compared to 2012 was mainly due to decreases in the purchase of marketable securities and the acquisition of
businesses and other assets.
Cash used in investing activities during 2012 primarily resulted from $4.87 billion for the net purchase of marketable securities,
$1.24 billion for capital expenditures related to the purchase of servers, network infrastructure, and the construction of data centers,
as well as $911 million for the acquisition of businesses and other assets, such as patents. The increase in cash used in investing
activities during 2012 compared to 2011 was mainly due to increases in the purchase of marketable securities, the acquisition of
businesses and other assets, and capital expenditures.
Cash used in investing activities during 2011 primarily resulted from the use of approximately $2.4 billion for the net purchase
of marketable securities. Our cash used in investing activities in 2011 also consisted of capital expenditures of $606 million related
to the purchase of servers, network infrastructure, and the construction of data centers.
We anticipate making capital expenditures in 2014 of approximately $2.0 billion to $2.5 billion.
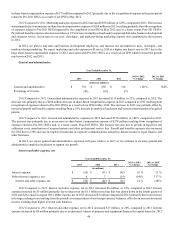
Cash (Used in) Provided by Financing Activities
Cash used in financing activities during 2013 was $667 million, which primarily resulted from $1.5 billion for repayment of
debt and $889 million of tax payments related to the net share settlement of equity awards, partially offset by $1.48 billion in net
proceeds from the completion of our follow-on equity offering in December 2013.
Cash provided by financing activities during 2012 was $6.28 billion, which primarily resulted from $6.8 billion in net proceeds
from the completion of our IPO, $1.5 billion draw down from our unsecured term loan facility and $1.03 billion of excess tax benefits
from stock award activities, partially offset by $2.86 billion of taxes paid related to the net share settlement of equity awards.
Cash provided by financing activities during 2011 was $1.2 billion, primarily resulted from $998 million in net proceeds related
to the completion of an offering of our Class A common stock to certain non-U.S. investors.
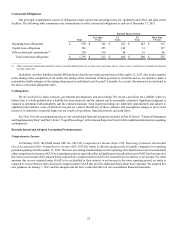
Off-Balance Sheet Arrangements
We did not have any off-balance sheet arrangements as of December 31, 2013.