Facebook 2013 Annual Report Download - page 36
Download and view the complete annual report
Please find page 36 of the 2013 Facebook annual report below. You can navigate through the pages in the report by either clicking on the pages listed below, or by using the keyword search tool below to find specific information within the annual report.-
 1
1 -
2
-
3
-
4
-
5
-
6
-
7
-
8
-
9
-
10
-
11
-
12
-
13
-
14
-
15
-
16
-
17
-
18
-
19
-
20
-
21
-
22
-
23
-
24
-
25
-
 26
26 -
 27
27 -
 28
28 -
 29
29 -
 30
30 -
 31
31 -
 32
32 -
 33
33 -
 34
34 -
 35
35 -
 36
36 -
 37
37 -
 38
38 -
 39
39 -
 40
40 -
 41
41 -
 42
42 -
 43
43 -
 44
44 -
 45
45 -
 46
46 -
47
-
48
-
49
-
50
-
51
-
52
-
53
-
54
-
55
-
56
-
57
-
58
-
59
-
60
-
61
-
62
-
63
-
64
-
65
-
66
-
67
-
68
-
69
-
70
-
71
-
72
-
73
-
74
-
75
-
76
-
77
-
78
-
79
-
80
-
81
-
82
-
83
-
84
-
85
-
86
-
87
-
88
-
89
-
90
-
91
-
92
-
93
-
94
-
95
-
96
 |
 |

34
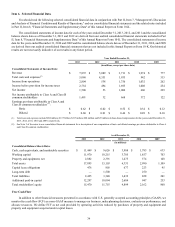
Item 6. Selected Financial Data.
You should read the following selected consolidated financial data in conjunction with Part II, Item 7, "Management's Discussion
and Analysis of Financial Condition and Results of Operations," and our consolidated financial statements and the related notes included
in Part II, Item 8, "Financial Statements and Supplementary Data" of this Annual Report on Form 10-K.
The consolidated statements of income data for each of the years ended December 31, 2013, 2012, and 2011 and the consolidated
balance sheets data as of December 31, 2013 and 2012 are derived from our audited consolidated financial statements included in Part
II, Item 8, "Financial Statements and Supplementary Data" of this Annual Report on Form 10-K. The consolidated statements of income
data for the years ended December 31, 2010 and 2009 and the consolidated balance sheets data as of December 31, 2011, 2010, and 2009
are derived from our audited consolidated financial statements that are not included in this Annual Report on Form 10-K. Our historical
results are not necessarily indicative of our results in any future period.
Year Ended December 31,
2013 2012 2011 2010 2009
(in millions, except per share data)
Consolidated Statements of Income Data:
Revenue $ 7,872 $ 5,089 $ 3,711 $ 1,974 $ 777
Total costs and expenses(1) 5,068 4,551 1,955 942 515
Income from operations 2,804 538 1,756 1,032 262
Income before provision for income taxes 2,754 494 1,695 1,008 254
Net income 1,500 53 1,000 606 229
Net income attributable to Class A and Class B
common stockholders 1,491 32 668 372 122
Earnings per share attributable to Class A and
Class B common stockholders (2):
Basic $ 0.62 $ 0.02 $ 0.52 $ 0.34 $ 0.12
Diluted $ 0.60 $ 0.01 $ 0.46 $ 0.28 $ 0.10
(1) Total costs and expenses include $906 million, $1.57 billion, $217 million, $20 million and $27 million of share-based compensation for the years ended December 31,
2013, 2012, 2011, 2010 and 2009, respectively.
(2) See Note 3 of the notes to our consolidated financial statements for a description of our computation of basic and diluted earnings per share attributable to Class A
and Class B common stockholders.
As of December 31,
2013 2012 2011 2010 2009
(in millions)
Consolidated Balance Sheets Data:
Cash, cash equivalents, and marketable securities $ 11,449 $ 9,626 $ 3,908 $ 1,785 $ 633
Working capital 11,970 10,215 3,705 1,857 703
Property and equipment, net 2,882 2,391 1,475 574 148
Total assets 17,895 15,103 6,331 2,990 1,109
Capital lease obligations 476 856 677 223 95
Long-term debt — 1,500 — 250 —
Total liabilities 2,425 3,348 1,432 828 241
Additional paid-in capital 12,297 10,094 2,684 947 253
Total stockholders' equity 15,470 11,755 4,899 2,162 868
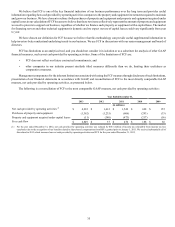
Free Cash Flow
In addition to other financial measures presented in accordance with U.S. generally accepted accounting principles (GAAP), we
monitor free cash flow (FCF) as a non-GAAP measure to manage our business, make planning decisions, evaluate our performance, and
allocate resources. We define FCF as net cash provided by operating activities reduced by purchases of property and equipment and
property and equipment acquired under capital leases.