Facebook 2013 Annual Report Download - page 63
Download and view the complete annual report
Please find page 63 of the 2013 Facebook annual report below. You can navigate through the pages in the report by either clicking on the pages listed below, or by using the keyword search tool below to find specific information within the annual report.-
 1
1 -
2
-
3
-
4
-
5
-
6
-
7
-
8
-
9
-
10
-
11
-
12
-
13
-
14
-
15
-
16
-
17
-
18
-
19
-
20
-
21
-
22
-
23
-
24
-
25
-
26
-
27
-
28
-
29
-
30
-
31
-
32
-
33
-
34
-
35
-
36
-
37
-
38
-
39
-
40
-
41
-
42
-
43
-
44
-
45
-
46
-
47
-
48
-
49
-
50
-
51
-
52
-
 53
53 -
 54
54 -
 55
55 -
 56
56 -
 57
57 -
 58
58 -
 59
59 -
 60
60 -
 61
61 -
 62
62 -
 63
63 -
 64
64 -
 65
65 -
 66
66 -
 67
67 -
 68
68 -
 69
69 -
 70
70 -
 71
71 -
 72
72 -
 73
73 -
74
-
75
-
76
-
77
-
78
-
79
-
80
-
81
-
82
-
83
-
84
-
85
-
86
-
87
-
88
-
89
-
90
-
91
-
92
-
93
-
94
-
95
-
96
 |
 |

61
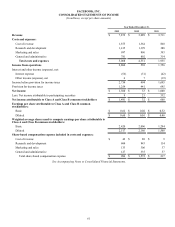
FACEBOOK, INC.
CONSOLIDATED STATEMENTS OF INCOME
(In millions, except per share amounts)
Year Ended December 31,
2013 2012 2011
Revenue $ 7,872 $ 5,089 $ 3,711
Costs and expenses:
Cost of revenue 1,875 1,364 860
Research and development 1,415 1,399 388
Marketing and sales 997 896 393
General and administrative 781 892 314
Total costs and expenses 5,068 4,551 1,955
Income from operations 2,804 538 1,756
Interest and other income (expense), net:
Interest expense (56)(51) (42)
Other income (expense), net 6 7 (19)
Income before provision for income taxes 2,754 494 1,695
Provision for income taxes 1,254 441 695
Net income $ 1,500 $ 53 $ 1,000
Less: Net income attributable to participating securities 9 21 332
Net income attributable to Class A and Class B common stockholders $ 1,491 $ 32 $ 668
Earnings per share attributable to Class A and Class B common
stockholders:
Basic $ 0.62 $ 0.02 $ 0.52
Diluted $ 0.60 $ 0.01 $ 0.46
Weighted average shares used to compute earnings per share attributable to
Class A and Class B common stockholders:
Basic 2,420 2,006 1,294
Diluted 2,517 2,166 1,508
Share-based compensation expense included in costs and expenses:
Cost of revenue $ 42 $ 88 $ 9
Research and development 604 843 114
Marketing and sales 133 306 37
General and administrative 127 335 57
Total share-based compensation expense $ 906 $ 1,572 $ 217
See Accompanying Notes to Consolidated Financial Statements.