Facebook 2013 Annual Report Download - page 51
Download and view the complete annual report
Please find page 51 of the 2013 Facebook annual report below. You can navigate through the pages in the report by either clicking on the pages listed below, or by using the keyword search tool below to find specific information within the annual report.-
 1
1 -
2
-
3
-
4
-
5
-
6
-
7
-
8
-
9
-
10
-
11
-
12
-
13
-
14
-
15
-
16
-
17
-
18
-
19
-
20
-
21
-
22
-
23
-
24
-
25
-
26
-
27
-
28
-
29
-
30
-
31
-
32
-
33
-
34
-
35
-
36
-
37
-
38
-
39
-
40
-
 41
41 -
 42
42 -
 43
43 -
 44
44 -
 45
45 -
 46
46 -
 47
47 -
 48
48 -
 49
49 -
 50
50 -
 51
51 -
 52
52 -
 53
53 -
 54
54 -
 55
55 -
 56
56 -
 57
57 -
 58
58 -
 59
59 -
 60
60 -
 61
61 -
62
-
63
-
64
-
65
-
66
-
67
-
68
-
69
-
70
-
71
-
72
-
73
-
74
-
75
-
76
-
77
-
78
-
79
-
80
-
81
-
82
-
83
-
84
-
85
-
86
-
87
-
88
-
89
-
90
-
91
-
92
-
93
-
94
-
95
-
96
 |
 |

49
in share-based compensation expense of $173 million compared to 2012 primarily due to the recognition of expense in the prior period
related to Pre-2011 RSUs as a result of our IPO in May 2012.
2012 Compared to 2011. Marketing and sales expenses in 2012 increased $503 million, or 128%, compared to 2011. The increase
was primarily due to an increase in share-based compensation expense of $269 million in 2012 resulting primarily from the recognition
of expenses related to Pre-2011 RSUs triggered by the completion of our IPO in May 2012 and, to a lesser extent, Post-2011 RSUs.
Payroll and benefits expenses also increased due to a 19% increase in employee headcount to support global sales, business development
and customer service. An increase in our user-, developer-, and marketer-facing marketing expense also contributed to the increase
in 2012.
In 2014, we plan to add sales and business development employees, and increase our investment in user-, developer-, and
marketer-facing marketing. We expect marketing and sales expenses will rise in 2014 at a higher rate than it rose in 2013 due to the
large share-based compensation expense in 2012 associated with Pre-2011 RSUs as a result of our IPO which lowered the growth
rate between 2012 and 2013.
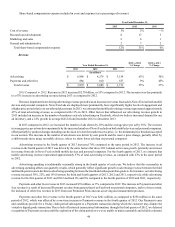
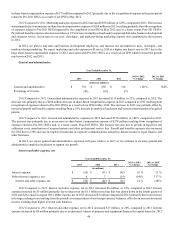
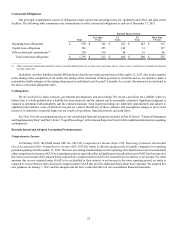
General and administrative
Year Ended December 31,
2013 2012 2011 2013 vs 2012
% Change 2012 vs 2011
% Change
(dollars in millions)
General and administrative $ 781 $ 892 $ 314 (12)% 184%
Percentage of revenue 10% 18% 8%
2013 Compared to 2012. General and administrative expenses in 2013 decreased $111 million, or 12%, compared to 2012. The
decrease was primarily due to a $208 million decrease in share-based compensation expense in 2013 compared to 2012 resulting from
recognition of expense related to Pre-2011 RSUs as a result of our IPO in May 2012. The decrease in 2013 was partially offset by
increased payroll and benefits expense resulting from a 19% increase in employee headcount and increased amortization of acquired
patents.
2012 Compared to 2011. General and administrative expenses in 2012 increased $578 million, or 184%, compared to 2011.
The increase was primarily due to an increase in share-based compensation expense of $278 million resulting from recognition of
expense related to Pre-2011 RSUs and, to a lesser extent, Post-2011 RSUs. The increase was also due to growth in legal fees and
settlement costs, amortization of acquired patents and other professional service fees. Payroll and benefits expenses also increased
for 2012 due to a 38% increase in employee headcount in corporate communications and policy, human resources, legal, finance, and
other functions.
In 2014, we expect general and administrative expenses will grow relative to 2013 as we continue to increase general and
administrative employee headcount to support our growth.
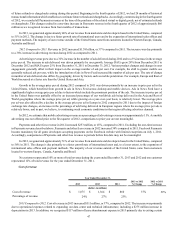
Interest and other expense, net
Year Ended December 31,
2013 2012 2011 2013 vs 2012
% Change 2012 vs 2011
% Change
(in millions)
Interest expense $ (56) $ (51) $ (42) 10 % 21 %
Other income (expense), net 6 7 (19) (14)% 137 %
Interest and other expense, net $ (50) $ (44) $ (61) 14 % (28)%
2013 Compared to 2012. Interest and other expense, net in 2013 increased $6 million, or 14%, compared to 2012. Interest
expense increased by $5 million primarily due to interest on the $1.5 billion term loan that was drawn down in the fourth quarter of
2012 and fully repaid in August 2013. Other income, net in 2013 decreased $1 million compared to 2012 primarily due to an increase
in foreign exchange loss resulting from the periodic re-measurement of our foreign currency balances, offset by an increase in interest
income resulting from higher invested cash balances.
2012 Compared to 2011. Interest and other expense, net in 2012 decreased $17 million, or 28%, compared to 2011. Interest
expense increased by $9 million primarily due to an increased volume of property and equipment financed by capital leases for 2012