Facebook 2013 Annual Report Download - page 53
Download and view the complete annual report
Please find page 53 of the 2013 Facebook annual report below. You can navigate through the pages in the report by either clicking on the pages listed below, or by using the keyword search tool below to find specific information within the annual report.-
 1
1 -
2
-
3
-
4
-
5
-
6
-
7
-
8
-
9
-
10
-
11
-
12
-
13
-
14
-
15
-
16
-
17
-
18
-
19
-
20
-
21
-
22
-
23
-
24
-
25
-
26
-
27
-
28
-
29
-
30
-
31
-
32
-
33
-
34
-
35
-
36
-
37
-
38
-
39
-
40
-
41
-
42
-
 43
43 -
 44
44 -
 45
45 -
 46
46 -
 47
47 -
 48
48 -
 49
49 -
 50
50 -
 51
51 -
 52
52 -
 53
53 -
 54
54 -
 55
55 -
 56
56 -
 57
57 -
 58
58 -
 59
59 -
 60
60 -
 61
61 -
 62
62 -
 63
63 -
64
-
65
-
66
-
67
-
68
-
69
-
70
-
71
-
72
-
73
-
74
-
75
-
76
-
77
-
78
-
79
-
80
-
81
-
82
-
83
-
84
-
85
-
86
-
87
-
88
-
89
-
90
-
91
-
92
-
93
-
94
-
95
-
96
 |
 |

51
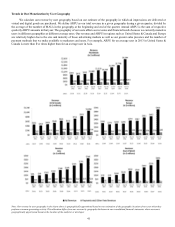
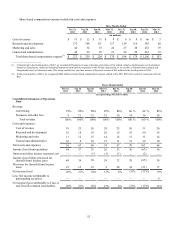
Quarterly Results of Operations Data
The following tables set forth our unaudited quarterly consolidated statements of operations data in dollars and as a percentage
of total revenue for each of the eight quarters in the period ended December 31, 2013. We have prepared the quarterly consolidated
statements of operations data on a basis consistent with the audited consolidated financial statements included in Part II, Item 8,
"Financial Statements and Supplementary Data" in this Annual Report on Form 10-K. In the opinion of management, the financial
information reflects all adjustments, consisting only of normal recurring adjustments, which we consider necessary for a fair
presentation of this data. This information should be read in conjunction with the audited consolidated financial statements and related
notes included in Part II, Item 8, "Financial Statements and Supplementary Data" in this Annual Report on Form 10-K. The results
of historical periods are not necessarily indicative of the results of operations for any future period.
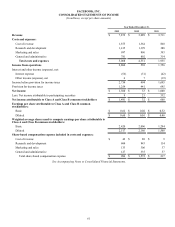
Three Months Ended
Dec 31,
2013 Sep 30,
2013 Jun 30,
2013 Mar 31,
2013 Dec 31,
2012 Sep 30,
2012 Jun 30,
2012 Mar 31,
2012
(in millions)
Consolidated Statements of Operations
Data:
Revenue:
Advertising $ 2,344 $ 1,798 $ 1,599 $ 1,245 $ 1,329 $ 1,086 $ 992 $ 872
Payments and other fees(1) 241 218 214 213 256 176 192 186
Total revenue 2,585 2,016 1,813 1,458 1,585 1,262 1,184 1,058
Costs and expenses:
Cost of revenue 491 507 465 413 398 322 367 277
Research and development 408 369 344 293 297 244 705 153
Marketing and sales 292 233 269 203 193 168 392 143
General and administrative 261 171 173 176 174 151 463 104
Total costs and expenses 1,452 1,280 1,251 1,085 1,062 885 1,927 677
Income (loss) from operations 1,133 736 562 373 523 377 (743) 381
Interest and other income (expense), net (3) (10) (17)(20)(18)(5)(22) 1
Income (loss) before provision for
(benefit from) income taxes 1,130 726 545 353 505 372 (765) 382
Provision for (benefit from) income taxes 607 301 212 134 441 431 (608) 177
Net income (loss) $ 523 $ 425 $ 333 $ 219 $ 64 $ (59) $ (157) $ 205
Less: Net income attributable to
participating securities 3 3 2 2 — — — 68
Net income (loss) attributable to Class A
and Class B common stockholders $ 520 $ 422 $ 331 $ 217 $ 64 $ (59) $ (157) $ 137
Earnings (loss) per share attributable to
Class A and Class B common
stockholders:
Basic $ 0.21 $ 0.17 $ 0.14 $ 0.09 $ 0.03 $ (0.02) $ (0.08) $ 0.10
Diluted $ 0.20 $ 0.17 $ 0.13 $ 0.09 $ 0.03 $ (0.02) $ (0.08) $ 0.09