Facebook 2013 Annual Report Download - page 67
Download and view the complete annual report
Please find page 67 of the 2013 Facebook annual report below. You can navigate through the pages in the report by either clicking on the pages listed below, or by using the keyword search tool below to find specific information within the annual report.-
 1
1 -
2
-
3
-
4
-
5
-
6
-
7
-
8
-
9
-
10
-
11
-
12
-
13
-
14
-
15
-
16
-
17
-
18
-
19
-
20
-
21
-
22
-
23
-
24
-
25
-
26
-
27
-
28
-
29
-
30
-
31
-
32
-
33
-
34
-
35
-
36
-
37
-
38
-
39
-
40
-
41
-
42
-
43
-
44
-
45
-
46
-
47
-
48
-
49
-
50
-
51
-
52
-
53
-
54
-
55
-
56
-
 57
57 -
 58
58 -
 59
59 -
 60
60 -
 61
61 -
 62
62 -
 63
63 -
 64
64 -
 65
65 -
 66
66 -
 67
67 -
 68
68 -
 69
69 -
 70
70 -
 71
71 -
 72
72 -
 73
73 -
 74
74 -
 75
75 -
 76
76 -
 77
77 -
78
-
79
-
80
-
81
-
82
-
83
-
84
-
85
-
86
-
87
-
88
-
89
-
90
-
91
-
92
-
93
-
94
-
95
-
96
 |
 |
65
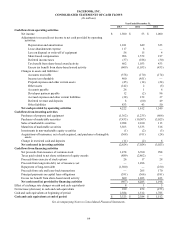
FACEBOOK, INC.
CONSOLIDATED STATEMENTS OF CASH FLOWS
(In millions)
Year Ended December 31,
2013 2012 2011
Supplemental cash flow data
Cash paid during the period for:
Interest $ 38 $ 38 $ 28
Income taxes $ 82 $ 184 $ 197
Cash received during the period for:
Refund of income taxes $ 421 $ 131 $ —
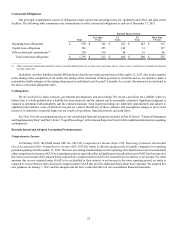
Non-cash investing and financing activities:
Net change in accounts payable and accrued expenses and other current
liabilities related to property and equipment additions $ 53 $ (40) $ 135
Property and equipment acquired under capital leases $ 11 $ 340 $ 473
Fair value of shares issued related to acquisitions of businesses and
other assets $ 77 $ 274 $ 58
See Accompanying Notes to Consolidated Financial Statements.