Facebook 2013 Annual Report Download - page 55
Download and view the complete annual report
Please find page 55 of the 2013 Facebook annual report below. You can navigate through the pages in the report by either clicking on the pages listed below, or by using the keyword search tool below to find specific information within the annual report.-
 1
1 -
2
-
3
-
4
-
5
-
6
-
7
-
8
-
9
-
10
-
11
-
12
-
13
-
14
-
15
-
16
-
17
-
18
-
19
-
20
-
21
-
22
-
23
-
24
-
25
-
26
-
27
-
28
-
29
-
30
-
31
-
32
-
33
-
34
-
35
-
36
-
37
-
38
-
39
-
40
-
41
-
42
-
43
-
44
-
 45
45 -
 46
46 -
 47
47 -
 48
48 -
 49
49 -
 50
50 -
 51
51 -
 52
52 -
 53
53 -
 54
54 -
 55
55 -
 56
56 -
 57
57 -
 58
58 -
 59
59 -
 60
60 -
 61
61 -
 62
62 -
 63
63 -
 64
64 -
 65
65 -
66
-
67
-
68
-
69
-
70
-
71
-
72
-
73
-
74
-
75
-
76
-
77
-
78
-
79
-
80
-
81
-
82
-
83
-
84
-
85
-
86
-
87
-
88
-
89
-
90
-
91
-
92
-
93
-
94
-
95
-
96
 |
 |

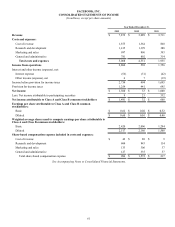
53
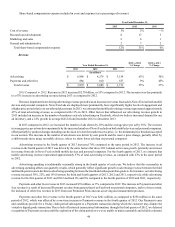
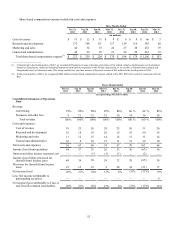
Share-based compensation expense included in costs and expenses:
Three Months Ended
Dec 31,
2013 Sep 30,
2013 Jun 30,
2013 Mar 31,
2013 Dec 31,
2012 Sep 30,
2012 Jun 30,
2012 Mar 31,
2012
(as a percentage of total revenue)
Cost of revenue —% 1% 1% 1% 1% 1% 6% —%
Research and development 7 8 8 8 8 9 46 6
Marketing and sales 2 2 2 2 2 2 20 2
General and administrative 2 1 2 1 2 2 22 2
Total share-based compensation expense 11% 12% 12% 12% 12% 14% 93% 10%
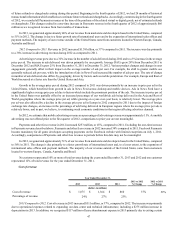
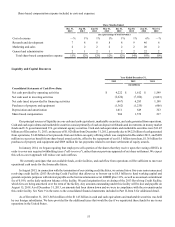
Liquidity and Capital Resources
Year Ended December 31,
2013 2012 2011
(in millions)
Consolidated Statements of Cash Flows Data:
Net cash provided by operating activities $ 4,222 $ 1,612 $ 1,549
Net cash used in investing activities (2,624)(7,024) (3,023)
Net cash (used in) provided by financing activities (667) 6,283 1,198
Purchases of property and equipment (1,362)(1,235) (606)
Depreciation and amortization 1,011 649 323
Share-based compensation 906 1,572 217
Our principal sources of liquidity are our cash and cash equivalents, marketable securities, and cash generated from operations.
Cash and cash equivalents and marketable securities consist primarily of cash on deposit with banks and investments in money market
funds and U.S. government and U.S. government agency securities. Cash and cash equivalents and marketable securities were $11.45
billion as of December 31, 2013, an increase of $1.82 billion from December 31, 2012, primarily due to $4.22 billion of cash generated
from operations, $1.48 billion of net proceeds from our follow-on equity offering which was completed in December 2013, and $609
million in excess tax benefit from share-based award activity, offset by the repayment of our $1.5 billion term loan, $1.36 billion for
purchases of property and equipment and $889 million for tax payments related to net share settlement of equity awards.
In January 2014, we began requiring that employees sell a portion of the shares that they receive upon the vesting of RSUs in
order to cover any required withholding taxes ("sell-to-cover"), rather than our previous approach of net share settlement. We expect
this sell-to-cover approach will reduce our cash outflows.
We currently anticipate that our available funds, credit facilities, and cash flow from operations will be sufficient to meet our
operational cash needs for the foreseeable future.
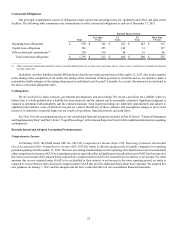
In August 2013, in connection with the termination of our existing credit facilities, we entered into a five-year senior unsecured
revolving credit facility (2013 Revolving Credit Facility) that allows us to borrow up to $6.5 billion to fund working capital and
general corporate purposes with interest payable on the borrowed amounts set at LIBOR plus 1.0%, as well as an annual commitment
fee of 0.10% on the daily undrawn balance of the facility. We paid origination fees at closing of the 2013 Revolving Credit Facility,
which fees are being amortized over the term of the facility. Any amounts outstanding under this facility will be due and payable on
August 15, 2018. As of December 31, 2013, no amounts had been drawn down and we were in compliance with the covenants under
this credit facility. See Note 9 in the notes to the consolidated financial statements included in Part II, Item 8 for additional detail.
As of December 31, 2013, $634 million of the $11.45 billion in cash and cash equivalents and marketable securities was held
by our foreign subsidiaries. We have provided for the additional taxes that would be due if we repatriated these funds for use in our
operations in the United States.