Facebook 2013 Annual Report Download - page 49
Download and view the complete annual report
Please find page 49 of the 2013 Facebook annual report below. You can navigate through the pages in the report by either clicking on the pages listed below, or by using the keyword search tool below to find specific information within the annual report.-
 1
1 -
2
-
3
-
4
-
5
-
6
-
7
-
8
-
9
-
10
-
11
-
12
-
13
-
14
-
15
-
16
-
17
-
18
-
19
-
20
-
21
-
22
-
23
-
24
-
25
-
26
-
27
-
28
-
29
-
30
-
31
-
32
-
33
-
34
-
35
-
36
-
37
-
38
-
 39
39 -
 40
40 -
 41
41 -
 42
42 -
 43
43 -
 44
44 -
 45
45 -
 46
46 -
 47
47 -
 48
48 -
 49
49 -
 50
50 -
 51
51 -
 52
52 -
 53
53 -
 54
54 -
 55
55 -
 56
56 -
 57
57 -
 58
58 -
 59
59 -
60
-
61
-
62
-
63
-
64
-
65
-
66
-
67
-
68
-
69
-
70
-
71
-
72
-
73
-
74
-
75
-
76
-
77
-
78
-
79
-
80
-
81
-
82
-
83
-
84
-
85
-
86
-
87
-
88
-
89
-
90
-
91
-
92
-
93
-
94
-
95
-
96
 |
 |

47
of future refunds or chargebacks arising during this period. Beginning in the fourth quarter of 2012, we had 24 months of historical
transactional information which enabled us to estimate future refunds and chargebacks. Accordingly, commencing in the fourth quarter
of 2012, we recorded all Payments revenues at the time of the purchase of the related virtual or digital goods, net of estimated refunds
or chargebacks. This change resulted in a one-time increase in Payments revenue in the fourth quarter of 2012 of approximately $66
million as we recognized revenue from four months of transactions.
In 2013, we generated approximately 46% of our revenue from marketers and developers based in the United States, compared
to 51% in 2012. The change is due to a faster growth rate of international users and to the expansion of international sales offices and
payment methods. The majority of our revenue outside of the United States came from customers located in Western Europe, Canada,
Australia and Brazil.
2012 Compared to 2011. Revenue in 2012 increased $1.38 billion, or 37% compared to 2011. The increase was due primarily
to a 36% increase in advertising revenue during 2012 as compared to 2011.
Advertising revenue grew due to a 32% increase in the number of ads delivered during 2012 and to a 3% increase in the average
price per ad. The increase in ads delivered was driven primarily by user growth. Average DAUs grew 28% from December 2011 to
December 2012 and MAUs grew 25% from December 31, 2011 to December 31, 2012. Various product changes and changes in user
engagement generally offset in their impact on the average number of ads per user. For example, the shift to greater mobile use
generally reduced ads per user, while the introduction of ads in News Feed increased the number of ads per user. The rate of change
in number of ads delivered also differs by geography, driven by factors such as mobile penetration. For example, Europe and Rest of
World increased at a faster rate than the United States and Asia.
Growth in the average price per ad during 2012 compared to 2011 was driven primarily by an increase in price per ad in the
United States, which benefited from growth in ads in News Feed across desktop and mobile devices. Ads in News Feed have a
significantly higher average price per ad due to factors which include the prominent position of the ads. The increase in price per ad
in the United States was partially offset by an increased percentage of our worldwide ads being delivered in the Asia and Rest of
World geographies where the average price per ad, while growing on a year-over-year basis, is relatively lower. The average price
per ad was also affected by a decline in the average price per ad in Europe in 2012 compared to 2011 due to the impact of foreign
exchange rate changes, an increase in the percentage of ads being delivered in European regions where the average price per ads is
relatively lower, and in part, we believe, to continuing weak economic conditions in that region affecting advertiser demand.
In 2012, we estimate that mobile advertising revenue as a percentage of advertising revenue was approximately 11%. As mobile
advertising was not offered prior to the first quarter of 2012, comparisons to prior year are not meaningful.
Payments and other fees revenue in 2012 increased $253 million, or 45%, compared to 2011. Excluding the one-time increase
in Payments revenue described above, Payments and other fees revenue in 2012 increased 34% compared to 2011. Facebook Payments
became mandatory for all game developers accepting payments on the Facebook website with limited exceptions on July 1, 2011.
Accordingly, comparisons of Payments and other fees revenue to periods before this date may not be meaningful.
In 2012, we generated approximately 51% of our revenue from marketers and developers based in the United States, compared
to 56% in 2011. The change is due primarily to a faster growth rate of international users and, to a lesser extent, to the expansion of
international sales offices and payment methods. The majority of our revenue outside of the United States came from customers
located in western Europe, Canada, Australia and Brazil.
No customer represented 10% or more of total revenue during the years ended December 31, 2013 and 2012 and one customer
represented 12% of total revenue for the year ended December 31, 2011.
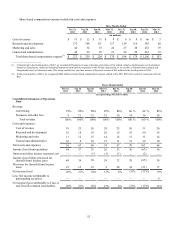
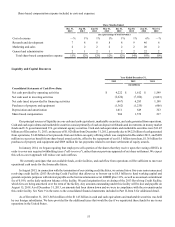
Cost of revenue
Year Ended December 31,
2013 2012 2011 2013 vs 2012
% Change 2012 vs 2011
% Change
(dollars in millions)
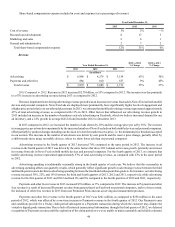
Cost of revenue $ 1,875 $ 1,364 $ 860 37% 59%
Percentage of revenue 24% 27% 23%
2013 Compared to 2012. Cost of revenue in 2013 increased $511 million, or 37%, compared to 2012. The increase was primarily
due to operational expenses related to expanding our data center and technical infrastructure, including a $275 million increase in
depreciation in 2013. In addition, we recognized $117 million of lease abandonment expense in 2013 primarily due to exiting certain