Facebook 2013 Annual Report Download - page 83
Download and view the complete annual report
Please find page 83 of the 2013 Facebook annual report below. You can navigate through the pages in the report by either clicking on the pages listed below, or by using the keyword search tool below to find specific information within the annual report.-
 1
1 -
2
-
3
-
4
-
5
-
6
-
7
-
8
-
9
-
10
-
11
-
12
-
13
-
14
-
15
-
16
-
17
-
18
-
19
-
20
-
21
-
22
-
23
-
24
-
25
-
26
-
27
-
28
-
29
-
30
-
31
-
32
-
33
-
34
-
35
-
36
-
37
-
38
-
39
-
40
-
41
-
42
-
43
-
44
-
45
-
46
-
47
-
48
-
49
-
50
-
51
-
52
-
53
-
54
-
55
-
56
-
57
-
58
-
59
-
60
-
61
-
62
-
63
-
64
-
65
-
66
-
67
-
68
-
69
-
70
-
71
-
72
-
 73
73 -
 74
74 -
 75
75 -
 76
76 -
 77
77 -
 78
78 -
 79
79 -
 80
80 -
 81
81 -
 82
82 -
 83
83 -
 84
84 -
 85
85 -
 86
86 -
 87
87 -
 88
88 -
 89
89 -
 90
90 -
 91
91 -
 92
92 -
 93
93 -
94
-
95
-
96
 |
 |

81
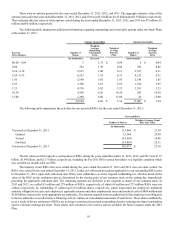
There were no options granted for the years ended December 31, 2013, 2012, and 2011. The aggregate intrinsic value of the
options exercised in the years ended December 31, 2013, 2012, and 2011 was $4.58 billion, $4.23 billion and $2.38 billion, respectively.
The total grant date fair value of stock options vested during the years ended December 31, 2013, 2012, and 2011 was $7 million, $5
million and $6 million, respectively.
The following table summarizes additional information regarding outstanding and exercisable options under the Stock Plans
at December 31, 2013:
Options Outstanding Options Exercisable
Exercise
Price (Range) Number of
Shares
Weighted
Average
Remaining
Contractual
Term
Weighted
Average
Exercise
Price Number of
Shares
Weighted
Average
Exercise
Price
(in thousands) (in years) (in thousands)
$0.00 - 0.04 5 1.72 $ 0.04 5 $ 0.04
0.06 762 1.99 0.06 762 0.06
0.10 - 0.18 2,527 2.48 0.11 2,527 0.11
0.29 - 0.33 6,232 3.24 0.31 6,232 0.31
1.85 2,140 5.03 1.85 2,140 1.85
2.95 1,360 5.63 2.95 1,014 2.95
3.23 4,376 5.82 3.23 3,701 3.23
10.39 3,500 6.56 10.39 583 10.39
15.00 1,200 6.80 15.00 43 15.00
22,102 4.66 $ 3.56 17,007 $ 1.64
The following table summarizes the activities for our unvested RSUs for the year ended December 31, 2013:
Unvested RSUs
Number of Shares Weighted Average Grant
Date Fair Value
(in thousands)
Unvested at December 31, 2012 113,044 $ 21.38
Granted 53,344 29.98
Vested (47,550) 16.96
Forfeited (14,867) 25.31
Unvested at December 31, 2013 103,971 $ 27.30
The fair value as of the respective vesting dates of RSUs during the years ended December 31, 2013, 2012, and 2011 was $1.55
billion, $1.99 billion, and $2.17 billion, respectively, including the Pre-2011 RSUs earned but subject to a liquidity condition which
was satisfied six months after our IPO.
The majority of our RSUs that were settled during the years ended December 31, 2013 and 2012 were net share settled. No
RSUs were settled in the year ended December 31, 2011. Under net settlement procedures applicable to our outstanding RSUs prior
to December 31, 2013, upon each settlement date, RSUs were withheld to cover the required withholding tax, which is based on the
value of the RSU on the settlement date as determined by the closing price of our common stock on the trading day immediately
preceding the applicable settlement date. The remaining amounts are delivered to the recipient as shares of our common stock. In
2013 and 2012, we settled 65 million and 279 million of RSUs, respectively, of which 64 million and 273 million RSUs were net
settled, respectively, by withholding 27 million and 123 million shares, respectively, which represented the employees' minimum
statutory obligation for each such employee's applicable income and other employment taxes and remitted cash of $889 million and
$2.86 billion, respectively, to the appropriate tax authorities. The amount remitted to the tax authorities for the employees' tax obligation
to the tax authorities was reflected as a financing activity within our consolidated statements of cash flows. These shares withheld by
us as a result of the net settlement of RSUs are no longer considered issued and outstanding, thereby reducing our shares outstanding
used to calculate earnings per share. These shares were returned to the reserves and are available for future issuance under the 2012
Plan.