Facebook 2013 Annual Report Download - page 85
Download and view the complete annual report
Please find page 85 of the 2013 Facebook annual report below. You can navigate through the pages in the report by either clicking on the pages listed below, or by using the keyword search tool below to find specific information within the annual report.-
 1
1 -
2
-
3
-
4
-
5
-
6
-
7
-
8
-
9
-
10
-
11
-
12
-
13
-
14
-
15
-
16
-
17
-
18
-
19
-
20
-
21
-
22
-
23
-
24
-
25
-
26
-
27
-
28
-
29
-
30
-
31
-
32
-
33
-
34
-
35
-
36
-
37
-
38
-
39
-
40
-
41
-
42
-
43
-
44
-
45
-
46
-
47
-
48
-
49
-
50
-
51
-
52
-
53
-
54
-
55
-
56
-
57
-
58
-
59
-
60
-
61
-
62
-
63
-
64
-
65
-
66
-
67
-
68
-
69
-
70
-
71
-
72
-
73
-
74
-
 75
75 -
 76
76 -
 77
77 -
 78
78 -
 79
79 -
 80
80 -
 81
81 -
 82
82 -
 83
83 -
 84
84 -
 85
85 -
 86
86 -
 87
87 -
 88
88 -
 89
89 -
 90
90 -
 91
91 -
 92
92 -
 93
93 -
 94
94 -
 95
95 -
96
 |
 |

83
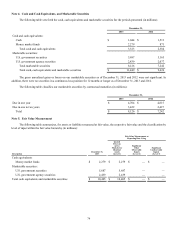
A reconciliation of the U.S. federal statutory income tax rate of 35.0% to our effective tax rate is as follows (in percentages):
Year Ended December 31,
2013 2012 2011
U.S. federal statutory income tax rate 35.0% 35.0% 35.0%
State income taxes, net of federal benefit 1.6 6.2 2.2
Research tax credits (4.7) — (1.0)
Share-based compensation 5.2 19.2 1.5
Effect of non-U.S. operations 6.8 26.9 3.3
Other 1.6 2.0 —
Effective tax rate 45.5% 89.3% 41.0%
Excess tax benefits associated with stock option exercises and other equity awards are credited to stockholders' equity. The income
tax benefits resulting from stock awards that were credited to stockholders' equity were $602 million, $1.03 billion and $433 million for
the years ended December 31, 2013, 2012, and 2011.
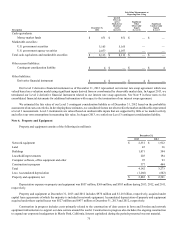
Our deferred tax assets (liabilities) are as follows (in millions):
December 31,
2013 2012
Deferred tax assets:
Net operating loss carryforward $ 6 $ 10
Tax credit carryforward 164 37
Share-based compensation 120 233
Accrued expenses and other liabilities 141 83
Other 5 16
Total deferred tax assets 436 379
Less: valuation allowance (82) (37)
Deferred tax assets, net of valuation allowance 354 342
Deferred tax liabilities:
Depreciation and amortization (68) (97)
Purchased intangible assets (90) (92)
Deferred foreign taxes (43) (15)
Total deferred tax liabilities (201) (204)
Net deferred tax assets $ 153 $ 138
The valuation allowance was approximately $82 million and $37 million as of December 31, 2013 and 2012, respectively, related
to state tax credits that we do not believe will ultimately be realized.
As of December 31, 2013, the U.S. federal and state net operating loss carryforwards were approximately $7.88 billion and $9.24
billion, which will begin to expire in 2027 and 2021, respectively, if not utilized. If realized, the impact of the net operating loss
carryforwards will be recognized as a benefit of approximately $2.89 billion through additional paid in capital. We have federal and state
tax credit carryforwards of $637 million and $651 million, respectively, which will expire beginning in 2032.
Utilization of our net operating loss and tax credit carryforwards may be subject to substantial annual limitations due to the
ownership change limitations provided by the Internal Revenue Code and similar state provisions. Such annual limitations could result
in the expiration of the net operating loss and tax credit carryforwards before their utilization. The events that may cause ownership
changes include, but are not limited to, a cumulative stock ownership change of greater than 50% over a three-year period.
Our net foreign pretax losses include jurisdictions with both pretax earnings and pretax losses. Our consolidated financial statements
provide taxes for all related tax liabilities that would arise upon repatriation of earnings in the foreign jurisdictions where we do not intend
to indefinitely reinvest those earnings outside the United States, and the amount of taxes provided for has been insignificant.