Facebook 2013 Annual Report Download - page 50
Download and view the complete annual report
Please find page 50 of the 2013 Facebook annual report below. You can navigate through the pages in the report by either clicking on the pages listed below, or by using the keyword search tool below to find specific information within the annual report.-
 1
1 -
2
-
3
-
4
-
5
-
6
-
7
-
8
-
9
-
10
-
11
-
12
-
13
-
14
-
15
-
16
-
17
-
18
-
19
-
20
-
21
-
22
-
23
-
24
-
25
-
26
-
27
-
28
-
29
-
30
-
31
-
32
-
33
-
34
-
35
-
36
-
37
-
38
-
39
-
 40
40 -
 41
41 -
 42
42 -
 43
43 -
 44
44 -
 45
45 -
 46
46 -
 47
47 -
 48
48 -
 49
49 -
 50
50 -
 51
51 -
 52
52 -
 53
53 -
 54
54 -
 55
55 -
 56
56 -
 57
57 -
 58
58 -
 59
59 -
 60
60 -
61
-
62
-
63
-
64
-
65
-
66
-
67
-
68
-
69
-
70
-
71
-
72
-
73
-
74
-
75
-
76
-
77
-
78
-
79
-
80
-
81
-
82
-
83
-
84
-
85
-
86
-
87
-
88
-
89
-
90
-
91
-
92
-
93
-
94
-
95
-
96
 |
 |

48
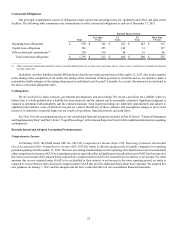
leased data centers resulting from the migration of operations to our own data centers. In the event that circumstances change such
that we decide to re-occupy and utilize any of the data centers we have exited, we would reverse the remaining lease abandonment
liability associated with those facilities. The increase in cost of revenue in 2013 was partially offset by a $46 million decrease in share-
based compensation expense compared to 2012 mainly due to the recognition of expense in the prior period related to Pre-2011 RSUs
as a result of our IPO in May 2012.
2012 Compared to 2011. Cost of revenue in 2012 increased $504 million, or 59%, compared to 2011. The increase was primarily
due to expenses related to expanding our data center operations, including a $257 million increase in depreciation in 2012. Share-
based compensation expense increased by $79 million in 2012 compared to 2011 mainly due to the recognition of expenses related
to Pre-2011 RSUs triggered by the completion of our IPO in May 2012 and, to a lesser extent, Post-2011 RSUs. Increases in payroll
and benefits expenses resulting from a 65% increase in employee headcount also contributed to the increase in cost of revenue in
2012. These expenses supported our user growth, the increased usage of products by users, developers, and marketers, and the launch
of new products.
We anticipate that the cost of revenue will increase in dollar amount in 2014 and for the foreseeable future as we expand our
data center capacity and technical infrastructure to support user growth, increased user engagement, and the delivery of new products
and offerings. The expected increase in cost of revenue may be partially mitigated to the extent we are able to realize improvements
in server and network performance and the efficiency of our technical operations.
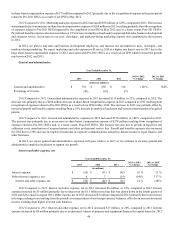
Research and development
Year Ended December 31,
2013 2012 2011 2013 vs 2012
% Change 2012 vs 2011
% Change
(dollars in millions)
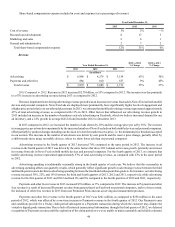
Research and development $ 1,415 $ 1,399 $ 388 1% 261%
Percentage of revenue 18% 27% 10%
2013 Compared to 2012. Research and development expenses in 2013 increased $16 million, or 1%, compared to 2012. The
increase was primarily due to an increase in payroll and benefits expense resulting from a 50% growth in employee headcount from
December 31, 2012 to December 31, 2013 in engineering and other technical functions. This increase in 2013 was offset by a $239
million decrease in share-based compensation expense compared to 2012 mainly due to the recognition of expense in the prior period
related to Pre-2011 RSUs as a result of our IPO in May 2012.
2012 Compared to 2011. Research and development expenses in 2012 increased $1.01 billion, or 261%, compared to 2011.
The increase was primarily due to an increase in share-based compensation expense of $729 million in 2012 resulting primarily from
the recognition of expenses related to Pre-2011 RSUs triggered by the completion of our IPO in May 2012 and, to a lesser extent,
Post-2011 RSUs. Payroll and benefits expense also increased due to a 73% growth in employee headcount in engineering, design,
product management, and other technical functions. This investment supported our efforts to improve existing products and build
new products for users, developers, and marketers.
In 2014, we plan to continue hiring software engineers and other technical employees. We expect research and development
expenses will rise in 2014 at a higher rate than it rose in 2013 due to the large share-based compensation expense in 2012 associated
with Pre-2011 RSUs as a result of our IPO which lowered the growth rate between 2012 and 2013.
Marketing and sales
Year Ended December 31,
2013 2012 2011 2013 vs 2012
% Change 2012 vs 2011
% Change
(dollars in millions)
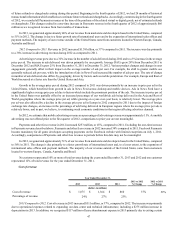
Marketing and sales $ 997 $ 896 $ 393 11% 128%
Percentage of revenue 13% 18% 11%
2013 Compared to 2012. Marketing and sales expenses in 2013 increased $101 million, or 11%, compared to 2012. The increase
was primarily due to an increase in payroll and benefits expenses resulting from a 36% increase in employee headcount from December
31, 2012 to December 31, 2013 to support global sales, business development and customer service. Our user-, developer-, and
marketer-facing marketing expense also contributed to the increase in 2013. These increases in 2013 were partially offset by a decrease