Facebook 2013 Annual Report Download - page 48
Download and view the complete annual report
Please find page 48 of the 2013 Facebook annual report below. You can navigate through the pages in the report by either clicking on the pages listed below, or by using the keyword search tool below to find specific information within the annual report.-
 1
1 -
2
-
3
-
4
-
5
-
6
-
7
-
8
-
9
-
10
-
11
-
12
-
13
-
14
-
15
-
16
-
17
-
18
-
19
-
20
-
21
-
22
-
23
-
24
-
25
-
26
-
27
-
28
-
29
-
30
-
31
-
32
-
33
-
34
-
35
-
36
-
37
-
 38
38 -
 39
39 -
 40
40 -
 41
41 -
 42
42 -
 43
43 -
 44
44 -
 45
45 -
 46
46 -
 47
47 -
 48
48 -
 49
49 -
 50
50 -
 51
51 -
 52
52 -
 53
53 -
 54
54 -
 55
55 -
 56
56 -
 57
57 -
 58
58 -
59
-
60
-
61
-
62
-
63
-
64
-
65
-
66
-
67
-
68
-
69
-
70
-
71
-
72
-
73
-
74
-
75
-
76
-
77
-
78
-
79
-
80
-
81
-
82
-
83
-
84
-
85
-
86
-
87
-
88
-
89
-
90
-
91
-
92
-
93
-
94
-
95
-
96
 |
 |

46
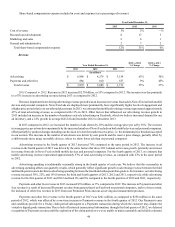
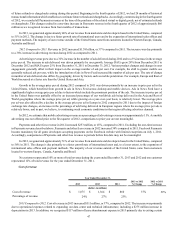
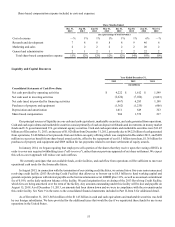
Share-based compensation expense included in costs and expenses (as a percentage of revenue):
Year Ended December 31,
2013 2012 2011
Cost of revenue 1% 2% —%
Research and development 8 17 3
Marketing and sales 2 6 1
General and administrative 2 7 2
Total share-based compensation expense 12% 31% 6%
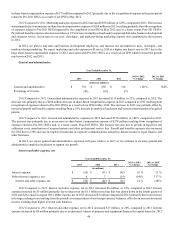
Revenue
Year Ended December 31, 2013 vs 2012
% Change 2012 vs 2011
% Change
2013 2012 2011
(in millions)
Advertising $ 6,986 $ 4,279 $ 3,154 63% 36%
Payments and other fees 886 810 557 9% 45%
Total revenue $ 7,872 $ 5,089 $ 3,711 55% 37%
2013 Compared to 2012. Revenue in 2013 increased $2.78 billion, or 55% compared to 2012. The increase was due primarily
to a 63% increase in advertising revenue during 2013 as compared to 2012.
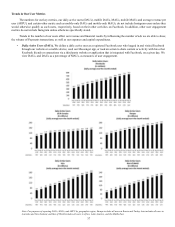
The most important factor driving advertising revenue growth was an increase in revenue from ads in News Feed on both mobile
devices and personal computers. News Feed ads are displayed more prominently, have significantly higher levels of engagement and
a higher price per ad relative to our other ad placements. In 2013, we estimate that mobile advertising revenue represented approximately
45% of total advertising revenue, as compared with 11% in 2012. Other factors that influenced our advertising revenue growth in
2013 included an increase in the number of marketers actively advertising on Facebook, which we believe increased demand for our
ad inventory, and a 22% growth in average DAUs from December 2012 to December 2013.
In 2013 compared to 2012, we increased the number of ads shown by 20% and the average price per ad by 36%. The increase
in average price per ad was driven primarily by the increased number of News Feed ads on both mobile devices and personal computers,
offset partially by product changes including our decision to lower the market reserve price, i.e. the minimum price threshold accepted
in our auction. The increase in the number of ads shown was driven by user growth and the reserve price change, partially offset by
a shift towards more usage on mobile devices, where we show fewer ads than on personal computers.
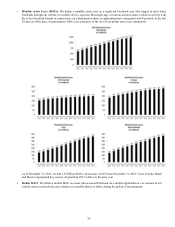
Advertising revenue in the fourth quarter of 2013 increased 76% compared to the same period in 2012. The increase in ad
revenue in the fourth quarter of 2013 was driven by the same factors that drove 2013 annual ad revenue growth, primarily an increase
in revenue from ads in News Feed on both mobile devices and personal computers. For the fourth quarter of 2013, we estimate that
mobile advertising revenue represented approximately 53% of total advertising revenue, as compared with 23% in the same period
in 2012.
Advertising spending is traditionally seasonally strong in the fourth quarter of each year. We believe that this seasonality in
advertising spending affects our quarterly results, which generally reflect significant growth in advertising revenue between the third
and fourth quarters and a decline in advertising spending between the fourth and subsequent first quarters. For instance, our advertising
revenue increased 30%, 22%, and 18% between the third and fourth quarters of 2013, 2012 and 2011, respectively, while advertising
revenue for the first quarter of 2013 and 2012 declined 6% and 8% compared to the fourth quarters of 2012 and 2011, respectively.
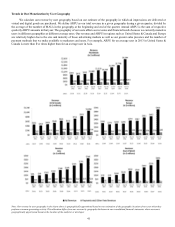
Payments and other fees revenue in 2013 increased $76 million, or 9%, compared to 2012. The increase in Payments and other
fees revenue is a result of increased Payments revenue from games played on Facebook on personal computers, and to a lesser extent,
the inclusion of other fees revenue in 2013 from user Promoted Posts and our ad serving and measurement products.
Payments and other fees revenue in the fourth quarter of 2013 was $241 million, as compared to $256 million in the same
period of 2012, which was affected by a one-time increase in Payments revenue in the fourth quarter of 2012. Our Payments terms
and conditions provide for a 30-day claim period subsequent to a Payments transaction during which the customer may dispute the
virtual or digital goods transaction. Due to lack of historical transactional information, through the third quarter of 2012, we deferred
recognition of Payments revenue until the expiration of the claim period as we were unable to make reasonable and reliable estimates