Facebook 2013 Annual Report Download - page 77
Download and view the complete annual report
Please find page 77 of the 2013 Facebook annual report below. You can navigate through the pages in the report by either clicking on the pages listed below, or by using the keyword search tool below to find specific information within the annual report.-
 1
1 -
2
-
3
-
4
-
5
-
6
-
7
-
8
-
9
-
10
-
11
-
12
-
13
-
14
-
15
-
16
-
17
-
18
-
19
-
20
-
21
-
22
-
23
-
24
-
25
-
26
-
27
-
28
-
29
-
30
-
31
-
32
-
33
-
34
-
35
-
36
-
37
-
38
-
39
-
40
-
41
-
42
-
43
-
44
-
45
-
46
-
47
-
48
-
49
-
50
-
51
-
52
-
53
-
54
-
55
-
56
-
57
-
58
-
59
-
60
-
61
-
62
-
63
-
64
-
65
-
66
-
 67
67 -
 68
68 -
 69
69 -
 70
70 -
 71
71 -
 72
72 -
 73
73 -
 74
74 -
 75
75 -
 76
76 -
 77
77 -
 78
78 -
 79
79 -
 80
80 -
 81
81 -
 82
82 -
 83
83 -
 84
84 -
 85
85 -
 86
86 -
 87
87 -
88
-
89
-
90
-
91
-
92
-
93
-
94
-
95
-
96
 |
 |
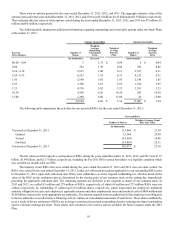
75
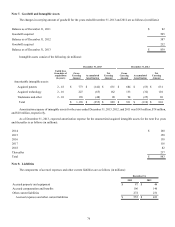
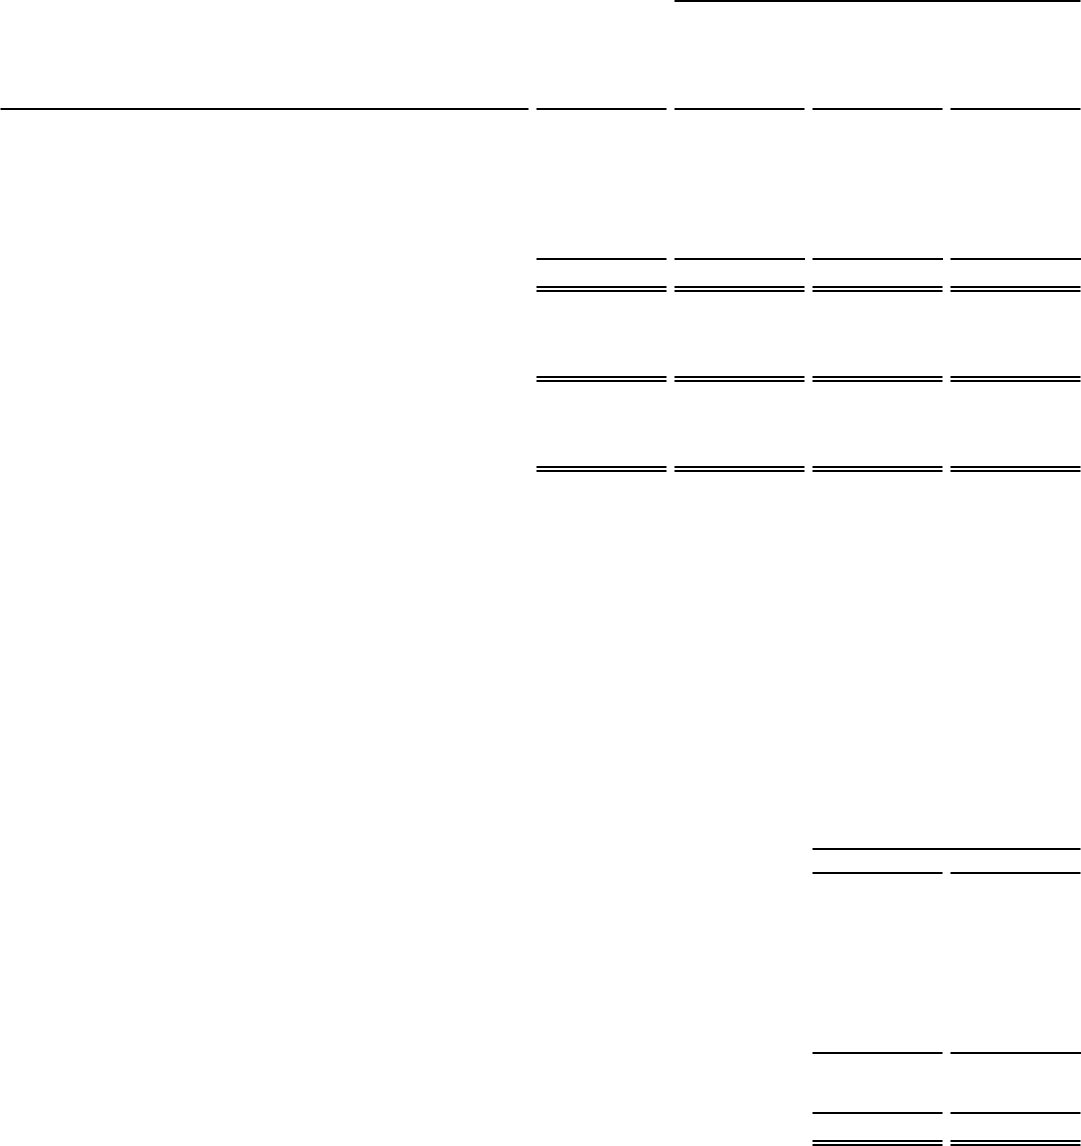
Fair Value Measurement at
Reporting Date Using
Description December 31,
2012
Quoted
Prices in
Active
Markets for
Identical
Assets
(Level 1)
Significant
Other
Observable
Inputs
(Level 2)
Significant
Unobservable
Inputs
(Level 3
Cash equivalents:
Money market funds $ 871 $ 871 $ — $ —
Marketable securities:
U.S. government securities 5,165 5,165 — —
U.S. government agency securities 2,077 2,077 — —
Total cash equivalents and marketable securities $ 8,113 $ 8,113 $ — $ —
Other current liabilities:
Contingent consideration liability $ 4 $ — $ — $ 4
Other liabilities:
Derivative financial instrument $ 4 $ — $ 4 $ —
Our Level 2 derivative financial instrument as of December 31, 2012 represented our interest rate swap agreement which was
valued based on a valuation model using significant inputs derived from or corroborated by observable market data. In August 2013, we
terminated our Level 2 derivative financial instrument related to our interest rate swap agreement. See Note 9 in these notes to the
consolidated financial statements for additional information with respect to the termination of our interest swap agreement.
We estimated the fair value of our Level 3 contingent consideration liability as of December 31, 2012 based on the probability
assessment of an earn-out criteria. In developing these estimates, we considered factors not observed in the market and thus this represented
a Level 3 measurement. Level 3 instruments are valued based on unobservable inputs that are supported by little or no market activity
and reflect our own assumptions in measuring fair value. In August 2013, we settled our Level 3 contingent consideration liability.
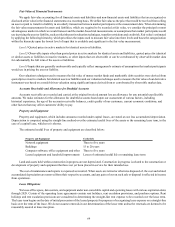
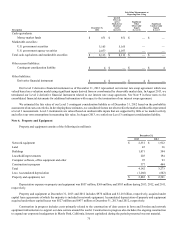
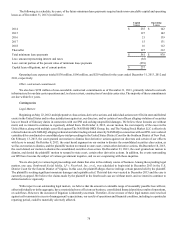
Note 6. Property and Equipment
Property and equipment consists of the following (in millions):
December 31,
2013 2012
Network equipment $ 2,351 $ 1,912
Land 45 36
Buildings 1,071 594
Leasehold improvements 203 194
Computer software, office equipment and other 95 93
Construction in progress 377 444
Total 4,142 3,273
Less: Accumulated depreciation (1,260) (882)
Property and equipment, net $ 2,882 $ 2,391
Depreciation expense on property and equipment was $857 million, $566 million, and $303 million during 2013, 2012, and 2011,
respectively.
Property and equipment at December 31, 2013 and 2012 includes $976 million and $1.28 billion, respectively, acquired under
capital lease agreements of which the majority is included in network equipment. Accumulated depreciation of property and equipment
acquired under these capital leases was $527 million and $437 million at December 31, 2013 and 2012, respectively.
Construction in progress includes costs primarily related to the construction of data centers in Iowa and Sweden and network
equipment infrastructure to support our data centers around the world. Construction in progress also includes the ongoing construction
to expand our corporate headquarters in Menlo Park, California. Interest capitalized during the periods presented was not material.