Facebook 2013 Annual Report Download - page 76
Download and view the complete annual report
Please find page 76 of the 2013 Facebook annual report below. You can navigate through the pages in the report by either clicking on the pages listed below, or by using the keyword search tool below to find specific information within the annual report.-
 1
1 -
2
-
3
-
4
-
5
-
6
-
7
-
8
-
9
-
10
-
11
-
12
-
13
-
14
-
15
-
16
-
17
-
18
-
19
-
20
-
21
-
22
-
23
-
24
-
25
-
26
-
27
-
28
-
29
-
30
-
31
-
32
-
33
-
34
-
35
-
36
-
37
-
38
-
39
-
40
-
41
-
42
-
43
-
44
-
45
-
46
-
47
-
48
-
49
-
50
-
51
-
52
-
53
-
54
-
55
-
56
-
57
-
58
-
59
-
60
-
61
-
62
-
63
-
64
-
65
-
 66
66 -
 67
67 -
 68
68 -
 69
69 -
 70
70 -
 71
71 -
 72
72 -
 73
73 -
 74
74 -
 75
75 -
 76
76 -
 77
77 -
 78
78 -
 79
79 -
 80
80 -
 81
81 -
 82
82 -
 83
83 -
 84
84 -
 85
85 -
 86
86 -
87
-
88
-
89
-
90
-
91
-
92
-
93
-
94
-
95
-
96
 |
 |

74
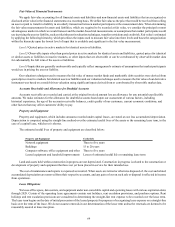
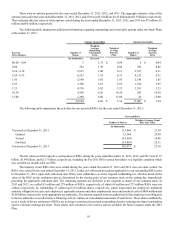
Note 4. Cash and Cash Equivalents, and Marketable Securities
The following table sets forth the cash, cash equivalents and marketable securities for the periods presented (in millions):
December 31,
2013 2012
Cash and cash equivalents:
Cash $ 1,044 $ 1,513
Money market funds 2,279 871
Total cash and cash equivalents 3,323 2,384
Marketable securities:
U.S. government securities 5,687 5,165
U.S. government agency securities 2,439 2,077
Total marketable securities 8,126 7,242
Total cash, cash equivalents and marketable securities $ 11,449 $ 9,626
The gross unrealized gains or losses on our marketable securities as of December 31, 2013 and 2012 were not significant. In
addition, there were no securities in a continuous loss position for 12 months or longer as of December 31, 2013 and 2012.
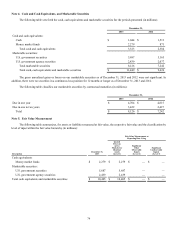
The following table classifies our marketable securities by contractual maturities (in millions):
December 31,
2013 2012
Due in one year $ 4,704 $ 4,815
Due in one to two years 3,422 2,427
Total $ 8,126 $ 7,242
Note 5. Fair Value Measurement
The following table summarizes, for assets or liabilities measured at fair value, the respective fair value and the classification by
level of input within the fair value hierarchy (in millions):
Fair Value Measurement at
Reporting Date Using
Description December 31,
2013
Quoted
Prices in
Active
Markets for
Identical
Assets
(Level 1)
Significant
Other
Observable
Inputs
(Level 2)
Significant
Unobservable
Inputs
(Level 3)
Cash equivalents:
Money market funds $ 2,279 $ 2,279 $ — $ —
Marketable securities:
U.S. government securities 5,687 5,687 — —
U.S. government agency securities 2,439 2,439 — —
Total cash equivalents and marketable securities $ 10,405 $ 10,405 $ — $ —