Microsoft 2008 Annual Report Download - page 17
Download and view the complete annual report
Please find page 17 of the 2008 Microsoft annual report below. You can navigate through the pages in the report by either clicking on the pages listed below, or by using the keyword search tool below to find specific information within the annual report.-
 1
1 -
2
-
3
-
4
-
5
-
6
-
 7
7 -
 8
8 -
 9
9 -
 10
10 -
 11
11 -
 12
12 -
 13
13 -
 14
14 -
 15
15 -
 16
16 -
 17
17 -
 18
18 -
 19
19 -
 20
20 -
 21
21 -
 22
22 -
 23
23 -
 24
24 -
 25
25 -
 26
26 -
 27
27 -
28
-
29
-
30
-
31
-
32
-
33
-
34
-
35
-
36
-
37
-
38
-
39
-
40
-
41
-
42
-
43
-
44
-
45
-
46
-
47
-
48
-
49
-
50
-
51
-
52
-
53
-
54
-
55
-
56
-
57
-
58
-
59
-
60
-
61
-
62
-
63
-
64
-
65
-
66
-
67
-
68
-
69
-
70
-
71
-
72
-
73
 |
 |

PAGE 16
MANAGEMENT’S DISCUSSION AND ANALYSIS OF FINANCIAL CONDITION AND
RESULTS OF OPERATIONS (CONTINUED)
Key market opportunities include:
Consumer technology. We are focused on delivering consumer software products that we believe are
compelling in terms of design, features, and functionality. We also are working to define the next era of
consumer electronics through the development of innovative software that runs on a wide range of devices
and connects people quickly and easily to the information, experiences, and communities they care about.
Software plus services. The ability to combine the power of desktop and server software with the reach
of the Internet represents an opportunity across every one of our businesses. We believe our software plus
services approach will enable us to deliver new experiences to end users and new value to businesses.
Expanding our presence on the desktop, the server, and with developers. Through our ability to
deliver additional value in security, messaging, systems management, and collaboration, and new
technology for high-performance computing, unified communications, and business intelligence, we believe
we are well-positioned to build on our strength with businesses of all sizes and with developers. Fiscal year
2008 saw widespread adoption of Windows Vista and the 2007 Microsoft Office system and the launch of
Windows Server 2008, SQL Server 2008, and Visual Studio 2008.
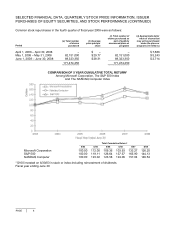
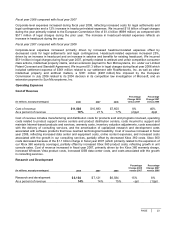
Summary of Results for Fiscal Years 2008, 2007, and 2006
(In millions, except percentages) 2008 2007 2006
Percentage
Change 2008
versus 2007
Percentage
Change 2007
versus 2006
Revenue $60,420 $51,122 $44,282 18% 15%
Operating income $22,492 $18,524 $16,472 21% 12%
Diluted earnings per share $1.87 $1.42 $1.20
32% 18%
Fiscal year 2008 compared with fiscal year 2007
Revenue growth was driven primarily by increased licensing of the 2007 Microsoft Office system, increased Xbox
360 platform sales, increased revenue associated with Windows Server and SQL Server, and increased licensing
of Windows Vista. Foreign currency exchange rates accounted for a $1.6 billion or three percentage point
increase in revenue during the year.
Operating income increased primarily reflecting increased revenue, partially offset by increased headcount-
related expenses, increased costs for legal settlements and legal contingencies, and increased cost of revenue.
Headcount-related expenses increased 12%, reflecting an increase in headcount during the year. We incurred
$1.8 billion of legal charges during the year primarily related to the European Commission fine of $1.4 billion
(€899 million) as compared with $511 million of legal charges during the prior year. Cost of revenue increased
$905 million or 8%, reflecting increased data center and equipment costs, online content expenses, and
increased costs associated with the growth in our consulting services, partially offset by decreased Xbox 360
costs. The decreased Xbox 360 costs reflect the $1.1 billion charge in fiscal year 2007 related to the expansion of
our Xbox 360 warranty coverage as discussed below, partially offset by increased Xbox 360 product costs
reflecting growth in unit console sales.
The diluted earnings per share growth was impacted by the $1.1 billion Xbox 360 charge in fiscal year 2007
and current year share repurchases.
Fiscal year 2007 compared with fiscal year 2006
Revenue growth was driven primarily by licensing of the 2007 Microsoft Office system and Windows Vista,
increased revenue associated with SQL Server, Windows Server, and Visual Studio, and increased Xbox 360
platform sales. Foreign currency exchange rates did not have a significant impact on consolidated revenue during
the year.
Operating income growth was driven primarily by increased revenue and decreased costs for legal settlements
and legal contingencies, partially offset by increased cost of revenue associated with Xbox 360 and Windows
Vista, increased OSB data centers costs, and increased sales and marketing expenses. In July 2007, we
expanded our global Xbox 360 warranty coverage to three years from the date of purchase for a general
hardware failure indicated by three flashing red lights. As a result, we recorded a $1.1 billion charge in fiscal year
2007 for anticipated costs under the warranty policy, inventory write-downs, and product returns. The increase in
sales and marketing expenses