Microsoft 2008 Annual Report Download - page 49
Download and view the complete annual report
Please find page 49 of the 2008 Microsoft annual report below. You can navigate through the pages in the report by either clicking on the pages listed below, or by using the keyword search tool below to find specific information within the annual report.-
 1
1 -
2
-
3
-
4
-
5
-
6
-
7
-
8
-
9
-
10
-
11
-
12
-
13
-
14
-
15
-
16
-
17
-
18
-
19
-
20
-
21
-
22
-
23
-
24
-
25
-
26
-
27
-
28
-
29
-
30
-
31
-
32
-
33
-
34
-
35
-
36
-
37
-
38
-
 39
39 -
 40
40 -
 41
41 -
 42
42 -
 43
43 -
 44
44 -
 45
45 -
 46
46 -
 47
47 -
 48
48 -
 49
49 -
 50
50 -
 51
51 -
 52
52 -
 53
53 -
 54
54 -
 55
55 -
 56
56 -
 57
57 -
 58
58 -
 59
59 -
60
-
61
-
62
-
63
-
64
-
65
-
66
-
67
-
68
-
69
-
70
-
71
-
72
-
73
 |
 |

PAGE 48
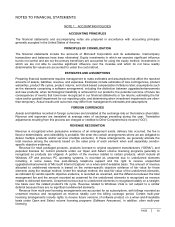
NOTES TO FINANCIAL STATEMENTS (CONTINUED)
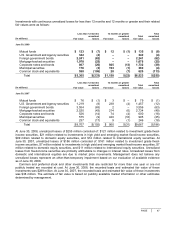
The maturities of debt securities, including fixed-maturity securities, at June 30, 2008, were as follows:
(In millions) Cost basis
Estimated fair
value
Due in one year or less $ 3,618
$3,618
Due after one year through five years 3,805
3,858
Due after five years through ten years 1,582
1,559
Due after ten years 7,831
7,846
Total $ 16,836
$16,881
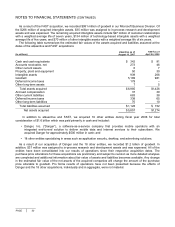
NOTE 5 DERIVATIVES
For derivative instruments designated as hedges, hedge ineffectiveness, determined in accordance with SFAS
No. 133, Accounting for Derivative Instruments and Hedging Activities, did not have a significant impact on
earnings for fiscal years 2008, 2007, or 2006. During fiscal year 2008, $274 million in gains on fair-value hedges
from changes in time value and $324 million in losses on cash-flow hedges from changes in time value were
excluded from the assessment of hedge effectiveness and were included in investment income and other. During
fiscal year 2007, $219 million in gains on fair-value hedges from changes in time value and $361 million in losses
on cash-flow hedges from changes in time value were excluded from the assessment of hedge effectiveness and
were included in investment income and other. During fiscal year 2006, $217 million in gains on fair-value hedges
from changes in time value and $399 million in losses on cash-flow hedges from changes in time value were
excluded from the assessment of hedge effectiveness and were included in investment income and other.
Derivative gains and losses included in OCI are reclassified into earnings at the time forecasted revenue or the
sale of an underlying investment is recognized. During fiscal year 2008, $104 million of derivative gains were
reclassified to revenue. During fiscal year 2007, $168 million of derivative gains were reclassified to revenue.
During fiscal year 2006, $166 million of derivative gains were reclassified to revenue and $23 million in derivative
gains were reclassified to investment income and other.
We estimate that $111 million of net derivative gains included in OCI will be reclassified into earnings within the
next 12 months. No significant amounts of gains or losses were reclassified from OCI into earnings as a result of
forecasted transactions that failed to occur for fiscal years 2008, 2007, and 2006.
Derivative fair values are based on quoted market prices or pricing models using current market data. The fair
values of all derivative positions were as follows:
(In millions)
Short-term
investments(1)
Other
current
assets
Equity and
other
investments(1)
Other
current
liabilities
Other
long-
term
liabilities Total
June 30, 2008
Cash-flow hedges $– $488 $– $ –
$
–
$488
Fair-value hedges (41)
–
767 (11)
–
715
Other derivatives 69 (34) 4 (20)
–
19
Total $28 $454 $771 $ (31)
$
–
$1,222
June 30, 2007
Cash-flow hedges $– $258 $ – $–
$ – $258
Fair-value hedges (11)
–
(29) (340)
(22) (402)
Other derivatives 9 (20) (6) (114)
– (131)
Total $(2) $238 $(35) $(454)
$ (22) $(275)
(1) The amounts presented as short-term investments and equity and other investments were classified as
investments in our balance sheets and were included in the amounts presented in Note 4 – Investments.