Microsoft 2008 Annual Report Download - page 21
Download and view the complete annual report
Please find page 21 of the 2008 Microsoft annual report below. You can navigate through the pages in the report by either clicking on the pages listed below, or by using the keyword search tool below to find specific information within the annual report.-
 1
1 -
2
-
3
-
4
-
5
-
6
-
7
-
8
-
9
-
10
-
 11
11 -
 12
12 -
 13
13 -
 14
14 -
 15
15 -
 16
16 -
 17
17 -
 18
18 -
 19
19 -
 20
20 -
 21
21 -
 22
22 -
 23
23 -
 24
24 -
 25
25 -
 26
26 -
 27
27 -
 28
28 -
 29
29 -
 30
30 -
 31
31 -
32
-
33
-
34
-
35
-
36
-
37
-
38
-
39
-
40
-
41
-
42
-
43
-
44
-
45
-
46
-
47
-
48
-
49
-
50
-
51
-
52
-
53
-
54
-
55
-
56
-
57
-
58
-
59
-
60
-
61
-
62
-
63
-
64
-
65
-
66
-
67
-
68
-
69
-
70
-
71
-
72
-
73
 |
 |

PAGE 20
MANAGEMENT’S DISCUSSION AND ANALYSIS OF FINANCIAL CONDITION AND
RESULTS OF OPERATIONS (CONTINUED)
company. Subsequently, we submitted several proposals to purchase Yahoo!’s search business and make an
investment in Yahoo!, all of which were rejected by Yahoo!. We continue to invest heavily in new tools, Web
experiences, improved search performance, and advertiser satisfaction, and we will continue to seek to build our
scale through organic growth, partnerships, and strategic acquisitions.
Fiscal year 2008 compared with fiscal year 2007
OSB revenue increased driven by increased online advertising revenue and the inclusion of aQuantive revenue,
partially offset by decreased access revenue. Online advertising revenue increased $553 million or 31%, to $2.3
billion. This increase reflects growth in our existing online advertising business and includes aQuantive online
advertising revenue of $161 million. Agency revenue, which is solely derived from aQuantive, was $345 million
during the year. Access revenue decreased $98 million or 28%, to $256 million, reflecting migration of subscribers
to broadband or other competitively-priced service providers. As of June 30, 2008, we estimate we had
approximately 460 million Windows Live IDs compared with 382 million as of the same date last year.
OSB operating loss increased driven by increased cost of revenue and other operating expenses, partially
offset by increased revenue. Cost of revenue increased $796 million or 71%, primarily driven by increased data
center and equipment costs, online content expenses, and aQuantive-related expenses. Sales and marketing
expenses increased $300 million or 35%, primarily due to increased amortization of customer-related intangible
assets of $94 million, increased headcount-related expenses, and increased marketing costs. Research and
development expenses increased $177 million or 18%, and general and administrative expenses increased $117
million or 175%, primarily reflecting increased headcount-related expenses and merger and acquisition-related
expenses. Headcount-related expenses increased 24%, driven by an increase in headcount during the year.
Fiscal year 2007 compared with fiscal year 2006
OSB revenue increased driven primarily by advertising revenue which grew $283 million or 19%, to $1.8 billion.
This increase was primarily due to growth in advertising for search, home page, email, and messaging services.
The increase in advertising revenue was partially offset by a $156 million or 31% decrease in access revenue.
OSB operating loss increased driven primarily by increased cost of revenue which grew $336 million or 42%,
and increased headcount-related expenses as a result of continued search and advertising platform investments.
The increase in cost of revenue was primarily driven by increased data center costs, online content expenses,
and royalties. Headcount-related expenses increased 31%, driven by an increase in headcount during the year.
Fiscal Year 2009 Outlook
We expect revenue, including advertising revenue, to increase in fiscal year 2009 as we begin to see returns from
investments we have made, including our acquisition of aQuantive. We also expect operating expenses to
increase as we continue to invest in our long-term strategy.
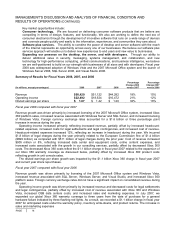
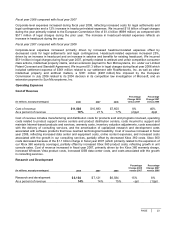
Microsoft Business Division
(In millions, except percentages) 2008 2007 2006
Percentage
Change 2008
versus 2007
Percentage
Change 2007
versus 2006
Revenue $18,932 $16,402 $14,465 15% 13%
Operating income $12,358 $10,777 $9,534 15% 13%
Microsoft Business Division (“MBD”) offerings consist of the Microsoft Office system and Microsoft Dynamics
business solutions. Microsoft Office system products are designed to increase personal, team, and organization
productivity through a range of programs, services, and software solutions. Growth of revenue from the Microsoft
Office system offerings, which generate over 90% of MBD revenue, depends on our ability to add value to the
core Office product set and to continue to expand our product offerings in other information worker areas such as
enterprise content management, collaboration, unified communications, and business intelligence. Microsoft