Microsoft 2008 Annual Report Download - page 19
Download and view the complete annual report
Please find page 19 of the 2008 Microsoft annual report below. You can navigate through the pages in the report by either clicking on the pages listed below, or by using the keyword search tool below to find specific information within the annual report.-
 1
1 -
2
-
3
-
4
-
5
-
6
-
7
-
8
-
 9
9 -
 10
10 -
 11
11 -
 12
12 -
 13
13 -
 14
14 -
 15
15 -
 16
16 -
 17
17 -
 18
18 -
 19
19 -
 20
20 -
 21
21 -
 22
22 -
 23
23 -
 24
24 -
 25
25 -
 26
26 -
 27
27 -
 28
28 -
 29
29 -
30
-
31
-
32
-
33
-
34
-
35
-
36
-
37
-
38
-
39
-
40
-
41
-
42
-
43
-
44
-
45
-
46
-
47
-
48
-
49
-
50
-
51
-
52
-
53
-
54
-
55
-
56
-
57
-
58
-
59
-
60
-
61
-
62
-
63
-
64
-
65
-
66
-
67
-
68
-
69
-
70
-
71
-
72
-
73
 |
 |

PAGE 18
MANAGEMENT’S DISCUSSION AND ANALYSIS OF FINANCIAL CONDITION AND
RESULTS OF OPERATIONS (CONTINUED)
Client operating income increased reflecting increased revenue, partially offset by increased sales and
marketing expenses and cost of revenue. Sales and marketing expenses increased $149 million or 10%, primarily
reflecting increased expenses associated with our corporate sales force. Cost of revenue increased $115 million
or 13%, primarily driven by Windows Vista product costs.
Fiscal year 2007 compared with fiscal year 2006
Client revenue increased primarily reflecting licensing of Windows Vista. OEM revenue increased $1.4 billion or
13% driven by 13% growth in OEM license units while revenue from commercial and retail licensing of Windows
operating systems increased $447 million or 22%. During the year, the OEM premium mix increased 15
percentage points to 67%. We estimate total worldwide PC shipments from all sources grew 10% to 12% driven
by demand in both emerging and mature markets.
Client operating income increased reflecting the increased revenue and decreased research and development
costs, partially offset by increased Windows Vista product costs and sales and marketing expenses for launch-
related programs. The decrease in research and development expenses reflected the capitalization of certain
Windows Vista software development costs and completion of product development on Windows Vista.
Headcount-related expenses decreased 7%, primarily driven by a decrease in headcount during the year.
Fiscal Year 2009 Outlook
We expect PC market growth will exceed Client revenue growth. We believe PC unit growth rates will be higher in
the consumer segment than in the business segment and higher in emerging markets than in mature markets.
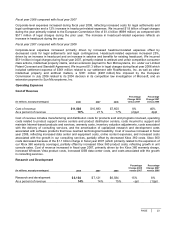
Server and Tools
(In millions, except percentages) 2008 2007 2006
Percentage
Change 2008
versus 2007
Percentage
Change 2007
versus 2006
Revenue $13,170 $11,171 $9,665 18% 16%
Operating income $ 4,593 $ 3,643 $2,868 26% 27%
Server and Tools concentrates on licensing products, applications, tools, content, and services that make
information technology professionals and developers more productive and efficient. Server and Tools offerings
consist of server software licenses and client access licenses (“CAL”) for Windows Server, Microsoft SQL Server,
and other server products. We also offer developer tools, training, certification, Microsoft Press, Premier and
Professional product support services, and Microsoft Consulting Services. Server products can be run on-site, in
a hosted environment, or in a Web-based environment. We use multiple channels for licensing, including pre-
installed OEM versions, licenses through partners, and licenses directly to end customers. We sell licenses both
as one-time licenses and as multi-year volume licenses.
Fiscal year 2008 compared with fiscal year 2007
Server and Tools revenue increased reflecting growth in product and services revenue and included a favorable
impact from foreign currency exchange rates of $464 million or four percentage points. Server and server
application revenue (including CAL revenue) and developer tools revenue increased $1.4 billion or 15%, primarily
driven by growth in volume licensing of Windows Server and SQL Server products. This growth reflects broad
adoption of the Windows Platform and applications with the releases of Windows Server 2008 and Visual Studio
2008 during the fiscal year. Consulting and Premier and Professional product support services revenue increased
$593 million or 29%, primarily due to higher demand for consulting and support services by corporate enterprises.
Server and Tools operating income increased primarily due to growth in high-margin product revenue, partially
offset by increased sales and marketing expenses, cost of revenue, and research and development expenses.
Sales and marketing expenses increased $475 million or 14%, due to higher expenses associated with our
corporate sales force. Cost of revenue increased $394 million or 18%, reflecting the growth in Consulting and
Premier and