Microsoft 2008 Annual Report Download - page 36
Download and view the complete annual report
Please find page 36 of the 2008 Microsoft annual report below. You can navigate through the pages in the report by either clicking on the pages listed below, or by using the keyword search tool below to find specific information within the annual report.-
 1
1 -
2
-
3
-
4
-
5
-
6
-
7
-
8
-
9
-
10
-
11
-
12
-
13
-
14
-
15
-
16
-
17
-
18
-
19
-
20
-
21
-
22
-
23
-
24
-
25
-
 26
26 -
 27
27 -
 28
28 -
 29
29 -
 30
30 -
 31
31 -
 32
32 -
 33
33 -
 34
34 -
 35
35 -
 36
36 -
 37
37 -
 38
38 -
 39
39 -
 40
40 -
 41
41 -
 42
42 -
 43
43 -
 44
44 -
 45
45 -
 46
46 -
47
-
48
-
49
-
50
-
51
-
52
-
53
-
54
-
55
-
56
-
57
-
58
-
59
-
60
-
61
-
62
-
63
-
64
-
65
-
66
-
67
-
68
-
69
-
70
-
71
-
72
-
73
 |
 |

PAGE 35
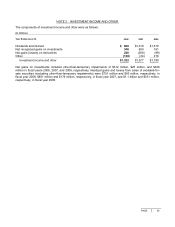
INCOME STATEMENTS
(In millions, except per share amounts)
Y
ear Ended June 30, 2008
2007 2006
Revenue $60,420 $51,122 $44,282
Operating expenses:
Cost of revenue 11,598 10,693 7,650
Research and development 8,164 7,121 6,584
Sales and marketing 13,039 11,455 9,818
General and administrative 5,127 3,329 3,758
Total operating expenses 37,928 32,598 27,810
Operating income 22,492 18,524 16,472
Investment income and other 1,322 1,577 1,790
Income before income taxes 23,814 20,101 18,262
Provision for income taxes 6,133 6,036 5,663
Net income $17,681 $14,065 $12,599
Earnings per share:
Basic $1.90
$1.44
$1.21
Diluted $1.87
$1.42
$1.20
Weighted average shares outstanding:
Basic 9,328 9,742 10,438
Diluted 9,470 9,886 10,531
Cash dividends declared per common share $0.44
$0.40
$0.35
See accompanying notes.