Microsoft 2008 Annual Report Download - page 53
Download and view the complete annual report
Please find page 53 of the 2008 Microsoft annual report below. You can navigate through the pages in the report by either clicking on the pages listed below, or by using the keyword search tool below to find specific information within the annual report.-
 1
1 -
2
-
3
-
4
-
5
-
6
-
7
-
8
-
9
-
10
-
11
-
12
-
13
-
14
-
15
-
16
-
17
-
18
-
19
-
20
-
21
-
22
-
23
-
24
-
25
-
26
-
27
-
28
-
29
-
30
-
31
-
32
-
33
-
34
-
35
-
36
-
37
-
38
-
39
-
40
-
41
-
42
-
 43
43 -
 44
44 -
 45
45 -
 46
46 -
 47
47 -
 48
48 -
 49
49 -
 50
50 -
 51
51 -
 52
52 -
 53
53 -
 54
54 -
 55
55 -
 56
56 -
 57
57 -
 58
58 -
 59
59 -
 60
60 -
 61
61 -
 62
62 -
 63
63 -
64
-
65
-
66
-
67
-
68
-
69
-
70
-
71
-
72
-
73
 |
 |

PAGE 52
NOTES TO FINANCIAL STATEMENTS (CONTINUED)
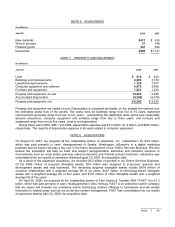
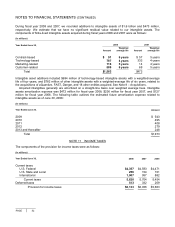
During fiscal year 2008 and 2007, we recorded additions to intangible assets of $1.6 billion and $473 million,
respectively. We estimate that we have no significant residual value related to our intangible assets. The
components of finite-lived intangible assets acquired during fiscal years 2008 and 2007 were as follows:
(In millions)
Year Ended June 30, 2008
2007
Amount
Weighted
average life
Amount
Weighted
average life
Contract-based $91 6 years $57
5 years
Technology-based 787 4 years 333 4 years
Marketing-related 116 5 years 14 4 years
Customer-related 589 6 years 69 5 years
Total $
1
,583
$
473
Intangible asset additions included $694 million of technology-based intangible assets with a weighted-average
life of four years, and $782 million of other intangible assets with a weighted-average life of six years, related to
the acquisitions of aQuantive, FAST, Danger, and 18 other entities acquired. See Note 8 – Acquisitions.
Acquired intangibles generally are amortized on a straight-line basis over weighted average lives. Intangible
assets amortization expense was $472 million for fiscal year 2008, $236 million for fiscal year 2007, and $127
million for fiscal year 2006. The following table outlines the estimated future amortization expense related to
intangible assets as of June 30, 2008:
(In millions)
Y
ear Ended June 30, Amount
2009 $543
2010 495
2011 408
2012 279
2013 and thereafter 248
Total $
1
,973
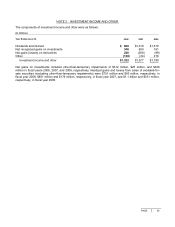
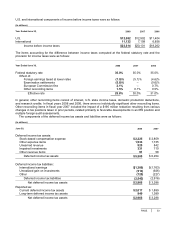
NOTE 11 INCOME TAXES
The components of the provision for income taxes were as follows:
(In millions)
Y
ear Ended June 30, 2008
2007 2006
Current taxes:
U.S. Federal $ 4,357
$
4,593 $4,471
U.S. State and Local 256 154 101
International 1,007 957 882
Current taxes 5,620 5,704 5,454
Deferred taxes 513 332 209
Provision for income taxes $ 6,133
$
6,036 $5,663