Microsoft 2008 Annual Report Download - page 25
Download and view the complete annual report
Please find page 25 of the 2008 Microsoft annual report below. You can navigate through the pages in the report by either clicking on the pages listed below, or by using the keyword search tool below to find specific information within the annual report.-
 1
1 -
2
-
3
-
4
-
5
-
6
-
7
-
8
-
9
-
10
-
11
-
12
-
13
-
14
-
 15
15 -
 16
16 -
 17
17 -
 18
18 -
 19
19 -
 20
20 -
 21
21 -
 22
22 -
 23
23 -
 24
24 -
 25
25 -
 26
26 -
 27
27 -
 28
28 -
 29
29 -
 30
30 -
 31
31 -
 32
32 -
 33
33 -
 34
34 -
 35
35 -
36
-
37
-
38
-
39
-
40
-
41
-
42
-
43
-
44
-
45
-
46
-
47
-
48
-
49
-
50
-
51
-
52
-
53
-
54
-
55
-
56
-
57
-
58
-
59
-
60
-
61
-
62
-
63
-
64
-
65
-
66
-
67
-
68
-
69
-
70
-
71
-
72
-
73
 |
 |

PAGE 24
MANAGEMENT’S DISCUSSION AND ANALYSIS OF FINANCIAL CONDITION AND
RESULTS OF OPERATIONS (CONTINUED)
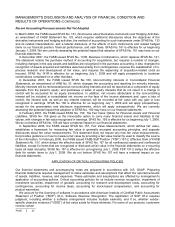
Research and development expenses include payroll, employee benefits, stock-based compensation expense,
and other headcount-related expenses associated with product development. Research and development
expenses also include third-party development and programming costs, localization costs incurred to translate
software for international markets, the amortization of purchased software code and services content, and in-
process research and development. Research and development expenses increased during fiscal year 2008
reflecting increased headcount-related expenses, increased product development costs, and in-process research
and development expenses related to acquisitions during the year. Headcount-related expenses increased 12%
during fiscal year 2008, reflecting an increase in headcount during the year. Research and development costs
increased during fiscal year 2007, primarily due to increased headcount-related expenses which grew 8%,
reflecting growth in headcount during the year.
Sales and Marketing
(In millions, except percentages) 2008 2007 2006
Percentage
Change 2008
versus 2007
Percentage
Change 2007
versus 2006
Sales and marketing $
1
3,039 $
1
1,455
$
9,818 14% 17%
As a percent of revenue 22 % 22 % 22 % –ppt –ppt
Sales and marketing expenses include payroll, employee benefits, stock-based compensation expense, and other
headcount-related expenses associated with sales and marketing personnel and advertising, promotions, trade
shows, seminars, and other programs. Sales and marketing expenses increased during fiscal year 2008, primarily
reflecting increased headcount-related expenses and increased corporate marketing and advertising campaigns.
Headcount-related expenses increased 14% during fiscal year 2008, reflecting an increase in headcount during
the year. Sales and marketing expenses increased during fiscal year 2007 primarily because of increased
headcount-related expenses and increased marketing costs related to product launches. Headcount-related
expenses increased 22% during fiscal year 2007, driven by an increase in headcount during the year.
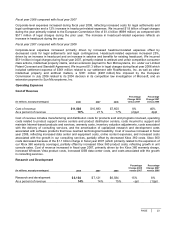
General and Administrative
(In millions, except percentages) 2008 2007 2006
Percentage
Change 2008
versus 2007
Percentage
Change 2007
versus 2006
General and administrative $5,127 $3,329 $3,758 54% (11)%
As a percent of revenue 8% 7% 8% 1ppt (1)ppt
General and administrative costs include payroll, employee benefits, stock-based compensation expense and
other headcount-related expenses associated with finance, legal, facilities, certain human resources, other
administrative headcount, and legal and other administrative fees. General and administrative expenses
increased during fiscal year 2008, reflecting increased costs for legal settlements and legal contingencies,
increased consulting and professional fees, and increased headcount-related expenses. We incurred $1.8 billion
of legal charges during fiscal year 2008, primarily related to the European Commission fine of $1.4 billion (€899
million) as compared with $511 million of legal charges during fiscal year 2007. Headcount-related expenses
increased 7% during fiscal year 2008, reflecting an increase in headcount during the year. During fiscal year
2007, we incurred $511 million of legal charges primarily related to antitrust and unfair competition consumer
class actions, intellectual property claims, and extension payment to Sun Microsystems, Inc. as compared with
$1.3 billion of legal charges in fiscal year 2006. Headcount-related expenses increased 15% during fiscal year
2007, driven by an increase in headcount during the year.