Microsoft 2008 Annual Report Download - page 7
Download and view the complete annual report
Please find page 7 of the 2008 Microsoft annual report below. You can navigate through the pages in the report by either clicking on the pages listed below, or by using the keyword search tool below to find specific information within the annual report.-
 1
1 -
 2
2 -
 3
3 -
 4
4 -
 5
5 -
 6
6 -
 7
7 -
 8
8 -
 9
9 -
 10
10 -
 11
11 -
 12
12 -
 13
13 -
 14
14 -
 15
15 -
 16
16 -
 17
17 -
 18
18 -
19
-
20
-
21
-
22
-
23
-
24
-
25
-
26
-
27
-
28
-
29
-
30
-
31
-
32
-
33
-
34
-
35
-
36
-
37
-
38
-
39
-
40
-
41
-
42
-
43
-
44
-
45
-
46
-
47
-
48
-
49
-
50
-
51
-
52
-
53
-
54
-
55
-
56
-
57
-
58
-
59
-
60
-
61
-
62
-
63
-
64
-
65
-
66
-
67
-
68
-
69
-
70
-
71
-
72
-
73
 |
 |

PAGE 6
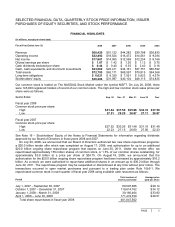
SELECTED FINANCIAL DATA, QUARTERLY STOCK PRICE INFORMATION, ISSUER
PURCHASES OF EQUITY SECURITIES, AND STOCK PERFORMANCE (CONTINUED)
Common stock repurchases in the fourth quarter of fiscal year 2008 were as follows:
Period
(a) Total number
of shares
purchased
(b) Average
price paid per
share
(c) Total number o
f
shares purchased as
part of publicly
announced plans or
programs
(d) Approximate dollar
value of shares that
may yet be purchased
under the plans or
programs (in millions)
April 1, 2008 – April 30, 2008 – $ – – $7,688
May 1, 2008 – May 31, 2008 82,151,000 $29.77 82,151,000 $5,243
June 1, 2008 – June 30, 2008 89,323,350 $28.31 89,323,350 $2,714
171,474,350 171,474,350
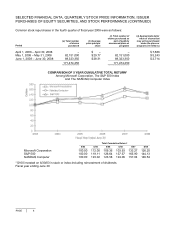
COMPARISON OF 5 YEAR CUMULATIVE TOTAL RETURN*
Among Microsoft Corporation, The S&P 500 Index
And The NASDAQ Computer Index
Total Cumulative Return*
6/03 6/04 6/05 6/06
6/07
6/08
Microsoft Corporation 100.00 112.00 109.36 103.93 133.27 126.20
S&P 500 100.00 119.11 126.64 137.57 165.90 144.13
NASDAQ Computer 100.00 123.02 123.58 124.06 157.04 146.54
* $100 invested on 6/30/03 in stock or index-including reinvestment of dividends.
Fiscal year ending June 30.