Microsoft 2008 Annual Report Download - page 64
Download and view the complete annual report
Please find page 64 of the 2008 Microsoft annual report below. You can navigate through the pages in the report by either clicking on the pages listed below, or by using the keyword search tool below to find specific information within the annual report.-
 1
1 -
2
-
3
-
4
-
5
-
6
-
7
-
8
-
9
-
10
-
11
-
12
-
13
-
14
-
15
-
16
-
17
-
18
-
19
-
20
-
21
-
22
-
23
-
24
-
25
-
26
-
27
-
28
-
29
-
30
-
31
-
32
-
33
-
34
-
35
-
36
-
37
-
38
-
39
-
40
-
41
-
42
-
43
-
44
-
45
-
46
-
47
-
48
-
49
-
50
-
51
-
52
-
53
-
 54
54 -
 55
55 -
 56
56 -
 57
57 -
 58
58 -
 59
59 -
 60
60 -
 61
61 -
 62
62 -
 63
63 -
 64
64 -
 65
65 -
 66
66 -
 67
67 -
 68
68 -
 69
69 -
 70
70 -
 71
71 -
 72
72 -
 73
73
 |
 |

PAGE 63
stock plan. Nonqualified and incentive stock options were granted to certain officers and employees under our
employee stock plans. Options granted between 1995 and 2001 generally vest over four and one-half years and
expire seven years from the date of grant, while certain options vest either over four and one-half years or over
seven and one-half years and expire ten years from the date of grant. Options granted after 2001 vest over four
and one-half years and expire ten years from the date of grant. Approximately ten million, two million, and one
million stock options were granted in conjunction with business acquisitions during fiscal years 2008, 2007, and
2006, respectively.
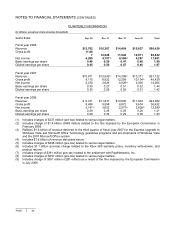
Employee stock options outstanding were as follows:
Shares
(in millions)
Weighted
Average
Exercise Price
Weighted
Average
Remaining
Contractual
Term (years)
Aggregate
Intrinsic
Value
(in millions)
Balance, June 30, 2007 524 $27.86
Granted 10 8.63
Exercised (121) 25.06
Canceled (48) 32.05
Forfeited (1) 15.58
Balance, June 30, 2008 364 $28.12 3.01 $
1
,029
Exercisable, June 30, 2008 357 $28.12 2.95 $899
Options outstanding as of June 30, 2008 include approximately 12 million options that were granted in conjunction
with business acquisitions. While these options are included in the options outstanding balance, they are
excluded from the weighted average exercise price of $28.12 presented. These options have an exercise price
range of $0 to $150.93 and a weighted average exercise price of $9.03.
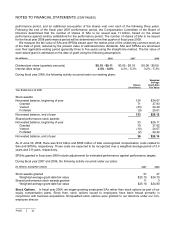
During fiscal years 2008, 2007, and 2006 the following activity occurred under our plans:
(In millions) 2008
2007 2006
Total intrinsic value of stock options exercised $
1
,042
$818 $491
Total fair value of stock awards vested $ 804
$566 $377
Total fair value of shared performance stock awards vested $ 336
$292 $ –
Cash received and income tax benefits from stock option exercises were $3.0 billion and $365 million,
respectively, for fiscal year 2008.
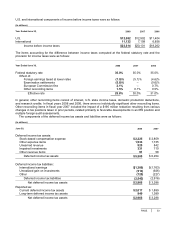
NOTE 19 SEGMENT INFORMATION
Segment revenue and operating income (loss) was as follows:
(In millions)
Y
ear Ended June 30, 2008
2007 2006
Revenue:
Client $16,472 $14,844 $13,077
Server and Tools 13,189 11,184 9,670
Online Services Business 3,214 2,441 2,303
Microsoft Business Division 18,937 16,404 14,461
Entertainment and Devices Division 8,139 6,066 4,761
Unallocated and other 469 183 10
Consolidated $60,420 $51,122 $44,282