Microsoft 2008 Annual Report Download - page 6
Download and view the complete annual report
Please find page 6 of the 2008 Microsoft annual report below. You can navigate through the pages in the report by either clicking on the pages listed below, or by using the keyword search tool below to find specific information within the annual report.-
 1
1 -
 2
2 -
 3
3 -
 4
4 -
 5
5 -
 6
6 -
 7
7 -
 8
8 -
 9
9 -
 10
10 -
 11
11 -
 12
12 -
 13
13 -
 14
14 -
 15
15 -
 16
16 -
 17
17 -
18
-
19
-
20
-
21
-
22
-
23
-
24
-
25
-
26
-
27
-
28
-
29
-
30
-
31
-
32
-
33
-
34
-
35
-
36
-
37
-
38
-
39
-
40
-
41
-
42
-
43
-
44
-
45
-
46
-
47
-
48
-
49
-
50
-
51
-
52
-
53
-
54
-
55
-
56
-
57
-
58
-
59
-
60
-
61
-
62
-
63
-
64
-
65
-
66
-
67
-
68
-
69
-
70
-
71
-
72
-
73
 |
 |

PAGE 5
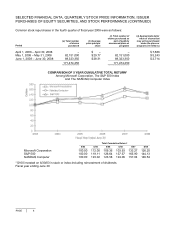
SELECTED FINANCIAL DATA, QUARTERLY STOCK PRICE INFORMATION, ISSUER
PURCHASES OF EQUITY SECURITIES, AND STOCK PERFORMANCE
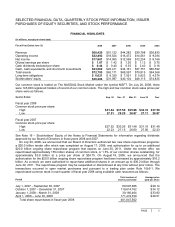
FINANCIAL HIGHLIGHTS
(In millions, except per share data)
Fiscal Year Ended June 30, 2008 2007 2006
2005 2004
Revenue $60,420 $51,122 $44,282 $ 39,788 $36,835
Operating income $22,492 $18,524 $16,472 $ 14,561 $ 9,034
Net income $17,681 $14,065 $12,599 $ 12,254 $ 8,168
Diluted earnings per share $1.87 $1.42 $1.20
$ 1.12 $0.75
Cash dividends declared per share $0.44 $0.40 $0.35
$ 3.40 $0.16
Cash, cash equivalents, and short-term investments $23,662 $23,411 $34,161 $ 37,751 $60,592
Total assets $72,793 $63,171 $69,597 $ 70,815 $94,368
Long-term obligations $6,621 $8,320 $ 7,051 $ 5,823 $ 4,574
Stockholders’ equity $36,286 $31,097 $40,104 $ 48,115 $74,825
Our common stock is traded on The NASDAQ Stock Market under the symbol MSFT. On July 28, 2008, there
were 145,903 registered holders of record of our common stock. The high and low common stock sales prices per
share were as follows:
Quarter Ended Sep. 30 Dec. 31
Mar. 31
June 30 Year
Fiscal year 2008
Common stock price per share:
High $31.84 $37.50 $35.96 $32.10 $37.50
Low 27.51 29.29 26.87 27.11 26.87
Fiscal year 2007
Common stock price per share:
High $27.52 $30.26 $31.48 $31.16 $31.48
Low 22.23 27.15 26.60 27.56 22.23
See Note 16 – Stockholders’ Equity of the Notes to Financial Statements for information regarding dividends
approved by our Board of Directors in fiscal years 2008 and 2007.
On July 20, 2006, we announced that our Board of Directors authorized two new share repurchase programs:
a $20.0 billion tender offer which was completed on August 17, 2006; and authorization for up to an additional
$20.0 billion ongoing share repurchase program that expires on June 30, 2011. Under the tender offer, we
repurchased approximately 155 million shares of common stock, or 1.5% of our common shares outstanding, for
approximately $3.8 billion at a price per share of $24.75. On August 18, 2006, we announced that the
authorization for the $20.0 billion ongoing share repurchase program had been increased by approximately $16.2
billion. As a result, we were authorized to repurchase additional shares in an amount up to $36.2 billion through
June 30, 2011. The repurchase program may be suspended or discontinued at any time without prior notice. The
transactions occurred in open market purchases and pursuant to a trading plan under Rule 10b5-1. We
repurchased common stock in each quarter of fiscal year 2008 using available cash resources as follows:
Period
Total number o
f
shares purchased
A
verage price
paid per share
July 1, 2007 – September 30, 2007 80,597,986 $29.14
October 1, 2007 – December 31, 2007 119,614,762 $34.12
January 1, 2008 – March 31, 2008 30,160,464 $33.82
April 1, 2008 – June 30, 2008 171,474,350 $29.01
Total share repurchases in fiscal year 2008 401,847,562