Microsoft 2008 Annual Report Download - page 22
Download and view the complete annual report
Please find page 22 of the 2008 Microsoft annual report below. You can navigate through the pages in the report by either clicking on the pages listed below, or by using the keyword search tool below to find specific information within the annual report.-
 1
1 -
2
-
3
-
4
-
5
-
6
-
7
-
8
-
9
-
10
-
11
-
 12
12 -
 13
13 -
 14
14 -
 15
15 -
 16
16 -
 17
17 -
 18
18 -
 19
19 -
 20
20 -
 21
21 -
 22
22 -
 23
23 -
 24
24 -
 25
25 -
 26
26 -
 27
27 -
 28
28 -
 29
29 -
 30
30 -
 31
31 -
 32
32 -
33
-
34
-
35
-
36
-
37
-
38
-
39
-
40
-
41
-
42
-
43
-
44
-
45
-
46
-
47
-
48
-
49
-
50
-
51
-
52
-
53
-
54
-
55
-
56
-
57
-
58
-
59
-
60
-
61
-
62
-
63
-
64
-
65
-
66
-
67
-
68
-
69
-
70
-
71
-
72
-
73
 |
 |

PAGE 21
Dynamics products provide business solutions for financial management, customer relationship management,
supply chain management, and analytics applications for small and mid-size businesses, large organizations, and
divisions of global enterprises. We evaluate our results based upon the nature of the end user in two primary
parts: business revenue, which includes Microsoft Office system revenue generated through volume licensing
agreements and Microsoft Dynamics revenue, and consumer revenue, which includes revenue from retail
packaged product sales and OEM revenue. In April 2008, we completed our acquisition of Fast Search & Transfer
ASA (“FAST”), an enterprise search company. We believe the acquisition will broaden our enterprise search
technology product offerings to businesses and will enable innovations in related areas such as our portal and
content management.
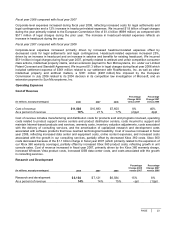
Fiscal year 2008 compared with fiscal year 2007
MBD revenue increased reflecting growth in licensing of the 2007 Microsoft Office system and included a
favorable impact from foreign currency exchange rates of $724 million or four percentage points. Business
revenue increased $2.6 billion or 21%, primarily as a result of growth in volume licensing agreement revenue and
strong transactional license sales to businesses. The increase in business revenue also included a 21% increase
in Microsoft Dynamics customer billings. Consumer revenue decreased $80 million or 2%, reflecting the
consumer launch of the 2007 Microsoft Office system in the prior fiscal year.
MBD operating income increased reflecting growth in revenue, partially offset by increased sales and
marketing expenses, research and development expenses, and cost of revenue. Sales and marketing expenses
increased $462 million or 13%, reflecting increased expenses associated with our corporate sales force.
Research and development expenses increased $228 million or 18%, primarily driven by an increase in
headcount-related expenses and a $35 million in-process research and development expense related to the
acquisition of FAST. Cost of revenue increased $225 million or 29%, primarily driven by an increase in online
services infrastructure costs and product costs related to retail packaged product sales. Headcount-related
expenses increased 10%, driven by an increase in headcount during the year.
Fiscal year 2007 compared with fiscal year 2006
MBD revenue increased primarily reflecting licensing of the 2007 Microsoft Office system and included a
favorable impact from foreign currency exchange rates of $247 million or two percentage points. Revenue from
consumer sales increased $339 million or 10% while revenue from business sales increased $1.6 billion or 15%.
The increase in business revenue included a 21% increase in Microsoft Dynamics customer billings.
MBD operating income increased reflecting the increased revenue, partially offset by increased sales and
marketing expenses and cost of revenue primarily associated with the 2007 Microsoft Office system. The increase
in sales and marketing expenses reflected increased headcount-related expenses, increased sales support costs
from our Enterprise Software Advisor channel partners, and increased launch-related marketing expenses.
Headcount-related expenses increased 8%, driven by an increase in headcount during the year.
Fiscal Year 2009 Outlook
We expect revenue to continue to increase over the prior year due to the strong performance of the 2007
Microsoft Office system and business demand for other applications. Fiscal year 2009 represents an important
year in delivering on our software plus services strategy with the upcoming releases of Exchange Online,
SharePoint Online, and Office Communication Server Online.
Entertainment and Devices Division
(In millions, except percentages) 2008 2007 2006
Percentage
Change 2008
versus 2007
Percentage
Change 2007
versus 2006
Revenue $8,140 $ 6,069 $4,732 34% 28%
Operating income (loss) $426 $(1,969) $(1,339) * (47)%
* Not meaningful