Microsoft 2008 Annual Report Download - page 66
Download and view the complete annual report
Please find page 66 of the 2008 Microsoft annual report below. You can navigate through the pages in the report by either clicking on the pages listed below, or by using the keyword search tool below to find specific information within the annual report.-
 1
1 -
2
-
3
-
4
-
5
-
6
-
7
-
8
-
9
-
10
-
11
-
12
-
13
-
14
-
15
-
16
-
17
-
18
-
19
-
20
-
21
-
22
-
23
-
24
-
25
-
26
-
27
-
28
-
29
-
30
-
31
-
32
-
33
-
34
-
35
-
36
-
37
-
38
-
39
-
40
-
41
-
42
-
43
-
44
-
45
-
46
-
47
-
48
-
49
-
50
-
51
-
52
-
53
-
54
-
55
-
 56
56 -
 57
57 -
 58
58 -
 59
59 -
 60
60 -
 61
61 -
 62
62 -
 63
63 -
 64
64 -
 65
65 -
 66
66 -
 67
67 -
 68
68 -
 69
69 -
 70
70 -
 71
71 -
 72
72 -
 73
73
 |
 |

PAGE 65
evaluate the alignment of product development organizations, sales organizations, and inter-segment
commissions for segment reporting purposes, which may result in changes to segment allocations in future
periods.
Assets are not allocated to segments for internal reporting presentations. A portion of amortization and
depreciation is included with various other costs in an overhead allocation to each segment and it is impracticable
for us to separately identify the amount of amortization and depreciation by segment that is included in the
measure of segment profit or loss.
Reconciling amounts include adjustments to conform with U.S. GAAP and corporate-level activity not
specifically attributed to a segment. Significant internal accounting policies that differ from U.S. GAAP relate to
revenue recognition, income statement classification, and accelerated amortization for depreciation, stock
awards, and performance-based stock awards. In addition, certain revenue and expenses are excluded from
segments or included in corporate-level activity including certain legal settlements and accruals for legal
contingencies.
Significant reconciling items were as follows:
(In millions)
Y
ear Ended June 30, 2008
2007 2006
Summary of reconciling amounts:
Corporate-level activity(1) $
(
6,704)
$
(
4,777) $
(
4,804)
Stock-based compensation expense 844
123 (173)
Revenue reconciling amounts 368
120 (7)
Other 46
77 (132)
Total $
(
5,446)
$
(
4,457) $
(
5,116)
(1) Corporate-level activity excludes stock-based compensation expense and revenue reconciling amounts
presented separately in those line items.
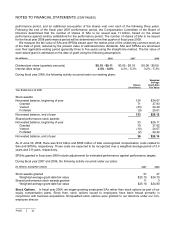
No sales to an individual customer accounted for more than 10% of fiscal year 2008 or fiscal year 2007
revenue. Sales to Dell and its subsidiaries accounted for approximately 11% of fiscal year 2006 revenue. These
sales were made primarily through our OEM and volume licensing channels and cover a broad array of products
including Windows PC operating systems, Microsoft Office, and server products.
Revenue, classified by the major geographic areas in which our customers are located, was as follows:
(In millions)
Y
ear Ended June 30, 2008
2007 2006
United States(1) $35,928 $ 31,346 $27,957
Other countries 24,492 19,776 16,325
Total $60,420 $ 51,122 $44,282
(1) Includes shipments to customers in the United States and licensing to certain OEMs and multinational
organizations.
Long-lived assets, classified by the geographic location of the controlling statutory company in which that
company operates, were as follows:
(In millions)
Y
ear Ended June 30, 2008 2007
United States $
1
9,129 $9,132
Other countries 1,194 856
Total $
2
0,323 $9,988