Microsoft 2008 Annual Report Download - page 18
Download and view the complete annual report
Please find page 18 of the 2008 Microsoft annual report below. You can navigate through the pages in the report by either clicking on the pages listed below, or by using the keyword search tool below to find specific information within the annual report.-
 1
1 -
2
-
3
-
4
-
5
-
6
-
7
-
 8
8 -
 9
9 -
 10
10 -
 11
11 -
 12
12 -
 13
13 -
 14
14 -
 15
15 -
 16
16 -
 17
17 -
 18
18 -
 19
19 -
 20
20 -
 21
21 -
 22
22 -
 23
23 -
 24
24 -
 25
25 -
 26
26 -
 27
27 -
 28
28 -
29
-
30
-
31
-
32
-
33
-
34
-
35
-
36
-
37
-
38
-
39
-
40
-
41
-
42
-
43
-
44
-
45
-
46
-
47
-
48
-
49
-
50
-
51
-
52
-
53
-
54
-
55
-
56
-
57
-
58
-
59
-
60
-
61
-
62
-
63
-
64
-
65
-
66
-
67
-
68
-
69
-
70
-
71
-
72
-
73
 |
 |

PAGE 17
was primarily driven by increased headcount-related expenses and marketing costs related to product launches.
Headcount-related expenses increased 18%, driven by an increase in headcount during the year.
Fiscal Year 2009 Outlook
Global macroeconomic factors have a strong correlation to demand for our software, services, hardware, and
online offerings. In fiscal year 2009, we expect a broad continuation of the economic conditions and demand we
experienced during the latter part of fiscal year 2008. In fiscal year 2009, we expect double digit revenue growth
and we estimate PC shipments will grow between 12% and 14%. Within the overall PC market, we expect current
trends to continue with consumer segment growth exceeding that of the business segment and emerging market
growth exceeding that of mature markets.
SEGMENT PRODUCT REVENUE/OPERATING INCOME (LOSS)
The revenue and operating income (loss) amounts in this section are presented on a basis consistent with U.S.
Generally Accepted Accounting Principles (“GAAP”) and include certain reconciling items attributable to each of
the segments. The segment information appearing in Note 19 – Segment Information of the Notes to Financial
Statements is presented on a basis consistent with the Company’s internal management reporting, in accordance
with Statement of Financial Accounting Standards (“SFAS”) No. 131, Disclosures about Segments of an
Enterprise and Related Information. Certain corporate-level activity has been excluded from our segment
operating results and is presented separately. Prior period amounts have been recast to conform to the way we
internally manage and monitor performance at the segment level during the current period.
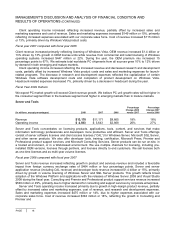
Client
(In millions, except percentages) 2008 2007 2006
Percentage
Change 2008
versus 2007
Percentage
Change 2007
versus 2006
Revenue $16,865 $14,976 $13,107 13% 14%
Operating income $13,052 $11,467 $10,208 14% 12%
Client offerings consist of premium and standard edition Windows operating systems. Premium editions are those
that include additional functionality and are sold at a price above our standard editions. Premium editions include
Windows Vista Business, Windows Vista Home Premium, Windows Vista Ultimate, Windows Vista Enterprise,
Windows XP Professional, Windows XP Media Center Edition, and Windows XP Tablet PC Edition. Standard
editions include Windows Vista Home Basic and Windows XP Home. Client revenue growth generally correlates
with the growth of PC purchases from OEMs that pre-install versions of Windows operating systems because the
OEM channel accounts for over 80% of total Client revenue. The differences between unit growth rates and
revenue growth rates from year to year are affected by changes in the mix of OEM Windows operating systems
licensed with premium edition operating systems as a percentage of total OEM Windows operating systems
licensed (“OEM premium mix”), changes in the geographical mix, and changes in the channel mix of products
sold by large, multi-national OEMs versus those sold by local and regional system builders.
Fiscal year 2008 compared with fiscal year 2007
Client revenue increased reflecting growth in licensing of Windows Vista. By the end of fiscal year 2008, more
than 180 million Windows Vista licenses had been sold (approximately 130 million were sold during fiscal year
2008) and millions of enterprise seats had been deployed. OEM revenue increased $1.7 billion or 13%, driven by
16% growth in OEM license units. Revenue from commercial and retail licensing of Windows operating systems
increased $209 million or 8%, primarily from Enterprise Agreements and anti-piracy efforts in emerging markets.
During the year, the OEM premium mix increased seven percentage points to 74%, reflecting strong demand for
Windows Vista Home Premium. Based on our estimates, total worldwide PC shipments from all sources grew
approximately 12% to 14%, driven by demand in both emerging and mature markets.