Microsoft 2008 Annual Report Download - page 63
Download and view the complete annual report
Please find page 63 of the 2008 Microsoft annual report below. You can navigate through the pages in the report by either clicking on the pages listed below, or by using the keyword search tool below to find specific information within the annual report.-
 1
1 -
2
-
3
-
4
-
5
-
6
-
7
-
8
-
9
-
10
-
11
-
12
-
13
-
14
-
15
-
16
-
17
-
18
-
19
-
20
-
21
-
22
-
23
-
24
-
25
-
26
-
27
-
28
-
29
-
30
-
31
-
32
-
33
-
34
-
35
-
36
-
37
-
38
-
39
-
40
-
41
-
42
-
43
-
44
-
45
-
46
-
47
-
48
-
49
-
50
-
51
-
52
-
 53
53 -
 54
54 -
 55
55 -
 56
56 -
 57
57 -
 58
58 -
 59
59 -
 60
60 -
 61
61 -
 62
62 -
 63
63 -
 64
64 -
 65
65 -
 66
66 -
 67
67 -
 68
68 -
 69
69 -
 70
70 -
 71
71 -
 72
72 -
 73
73
 |
 |

PAGE 62
NOTES TO FINANCIAL STATEMENTS (CONTINUED)
performance period, and an additional one-quarter of the shares vest over each of the following three years.
Following the end of the fiscal year 2007 performance period, the Compensation Committee of the Board of
Directors determined that the number of shares of SAs to be issued was 11 million, based on the actual
performance against metrics established for the performance period. The number of shares of SAs to be issued
for the fiscal year 2008 performance period will be determined in the first quarter of fiscal year 2009.
We measure the fair value of SAs and SPSAs based upon the market price of the underlying common stock as
of the date of grant, reduced by the present value of estimated future dividends. SAs and SPSAs are amortized
over their applicable vesting period (generally three to five years) using the straight-line method. The fair value of
each award grant is estimated on the date of grant using the following assumptions:
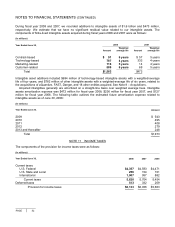
(In millions) 2008 2007 2006
Dividend per share (quarterly amounts) $0.10 - $0.11 $0.09 - $0.10 $0.08 - $0.09
Interest rates range 2.5% - 4.9% 4.3% - 5.3% 3.2% - 5.3%
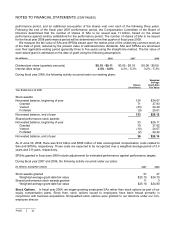
During fiscal year 2008, the following activity occurred under our existing plans:
Shares
(in millions)
Weighted
Average
Grant-Date
Fair Value
Y
ear Ended June 30, 2008
Stock awards:
Nonvested balance, beginning of year 124 $24.67
Granted 71 27.83
Vested (33) 24.49
Forfeited (9) 25.61
Nonvested balance, end of year 153 $26.12
Shared performance stock awards:
Nonvested balance, beginning of year 33 $24.11
Granted 19 27.82
Vested (14) 24.07
Forfeited (2) 24.44
Nonvested balance, end of year 36 $26.14
As of June 30, 2008, there was $3.2 billion and $586 million of total unrecognized compensation costs related to
SAs and SPSAs, respectively. These costs are expected to be recognized over a weighted average period of 3.4
years and 2.8 years, respectively.
SPSAs granted in fiscal year 2008 include adjustments for estimated performance against performance targets.
During fiscal year 2007 and 2006, the following activity occurred under our plans:
(In millions, except fair values) 2007 2006
Stock awards granted 57 47
Weighted average grant-date fair value $ 25.15 $24.70
Shared performance stock awards granted 11 3
Weighted average grant-date fair value $ 25.18 $24.80
Stock Options. In fiscal year 2004, we began granting employees SAs rather than stock options as part of our
equity compensation plans. Since then, stock options issued to employees have been issued primarily in
conjunction with business acquisitions. Nonqualified stock options were granted to our directors under our non-
employee director