Microsoft 2008 Annual Report Download - page 28
Download and view the complete annual report
Please find page 28 of the 2008 Microsoft annual report below. You can navigate through the pages in the report by either clicking on the pages listed below, or by using the keyword search tool below to find specific information within the annual report.-
 1
1 -
2
-
3
-
4
-
5
-
6
-
7
-
8
-
9
-
10
-
11
-
12
-
13
-
14
-
15
-
16
-
17
-
 18
18 -
 19
19 -
 20
20 -
 21
21 -
 22
22 -
 23
23 -
 24
24 -
 25
25 -
 26
26 -
 27
27 -
 28
28 -
 29
29 -
 30
30 -
 31
31 -
 32
32 -
 33
33 -
 34
34 -
 35
35 -
 36
36 -
 37
37 -
 38
38 -
39
-
40
-
41
-
42
-
43
-
44
-
45
-
46
-
47
-
48
-
49
-
50
-
51
-
52
-
53
-
54
-
55
-
56
-
57
-
58
-
59
-
60
-
61
-
62
-
63
-
64
-
65
-
66
-
67
-
68
-
69
-
70
-
71
-
72
-
73
 |
 |

PAGE 27
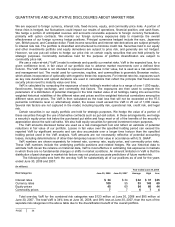
Undelivered elements – Represents free post-delivery telephone support and the right to receive unspecified
upgrades/enhancements of Microsoft Internet Explorer on a when-and-if-available basis. This revenue deferral is
applicable for Windows XP and prior versions shipped as retail packaged products, products licensed to original
equipment manufacturers (“OEM”), and perpetual licenses for current products under our Open and Select
volume licensing programs. The amount recorded as unearned is based on the sales price of those elements
when sold separately and is recognized ratably on a straight-line basis over the related product’s life cycle. The
percentage of revenue recorded as unearned due to undelivered elements ranges from approximately 15% to
25% of the sales price for Windows XP Home and approximately 5% to 15% of the sales price for Windows XP
Professional, depending on the terms and conditions of the license and prices of the elements. Product life cycles
are currently estimated at three and one-half years for Windows operating systems.
Other – Represents payments for post-delivery support and consulting services to be performed in the future,
online advertising for which the advertisement has yet to be displayed, Microsoft Dynamics business solutions
products, Xbox Live subscriptions, Mediaroom, and other offerings for which we have been paid upfront and earn
the revenue when we provide the service or software, or otherwise meet the revenue recognition criteria.
The following table outlines the expected recognition of unearned revenue as of June 30, 2008:
(In millions)
Recognition o
f
Unearned Revenue
Three months ended:
September 30, 2008 $5,120
December 31, 2008 4,033
March 31, 2009 2,775
June 30, 2009 1,469
Thereafter 1,900
Unearned revenue $15,297
Cash Flows
Fiscal year 2008 compared with fiscal year 2007
Cash flow from operations increased $3.8 billion due to an increase in cash received from customers driven by
18% revenue growth, partially offset by the $1.4 billion (€899 million) payment of the European Commission fine.
Cash used for financing decreased $11.6 billion primarily due to a $15.0 billion decrease in common stock
repurchases, partially offset by a $3.3 billion decrease in cash proceeds from the issuance of common stock.
Cash used for investing was $4.6 billion for fiscal year 2008 as compared with cash provided of $6.1 billion for
fiscal year 2007. This decrease was primarily due to a $6.9 billion increase in cash paid for acquisition of
companies, reflecting the purchase of aQuantive in the first quarter of fiscal year 2008, a $918 million increase in
purchases of property and equipment, and a $3.1 billion decrease in cash from combined investment purchases,
sales, and maturities.
As a result of our settlement related to the 2000-2003 examination, we paid the IRS approximately $3.1 billion
during the first quarter of fiscal year 2009.
Fiscal year 2007 compared with fiscal year 2006
Cash flow from operations increased $3.4 billion due to an increase in cash received from customers driven by
15% revenue growth, along with a $1.6 billion decrease in cash outflow for other current assets primarily reflecting
changes in inventory. Cash used for financing increased $4.0 billion. Several events occurred during fiscal year
2007 affecting cash used for financing. We issued $6.8 billion of common stock, including $3.3 billion related to
113 million call options exercised by JPMorgan in December 2006. We also completed our tender offer on
August 17, 2006, which was included in the $27.6 billion of common stock repurchases. Cash from investing
decreased $1.9 billion due to a $3.5 billion decline in securities lending activity where cash collateral is received
from the counterparty along with $1.2 billion spent on acquisitions of companies and additions to property and
equipment. These impacts were partially offset by a $2.8 billion increase in net cash from combined investment
purchases, sales, and maturities.