Microsoft 2008 Annual Report Download - page 46
Download and view the complete annual report
Please find page 46 of the 2008 Microsoft annual report below. You can navigate through the pages in the report by either clicking on the pages listed below, or by using the keyword search tool below to find specific information within the annual report.-
 1
1 -
2
-
3
-
4
-
5
-
6
-
7
-
8
-
9
-
10
-
11
-
12
-
13
-
14
-
15
-
16
-
17
-
18
-
19
-
20
-
21
-
22
-
23
-
24
-
25
-
26
-
27
-
28
-
29
-
30
-
31
-
32
-
33
-
34
-
35
-
 36
36 -
 37
37 -
 38
38 -
 39
39 -
 40
40 -
 41
41 -
 42
42 -
 43
43 -
 44
44 -
 45
45 -
 46
46 -
 47
47 -
 48
48 -
 49
49 -
 50
50 -
 51
51 -
 52
52 -
 53
53 -
 54
54 -
 55
55 -
 56
56 -
57
-
58
-
59
-
60
-
61
-
62
-
63
-
64
-
65
-
66
-
67
-
68
-
69
-
70
-
71
-
72
-
73
 |
 |

PAGE 45
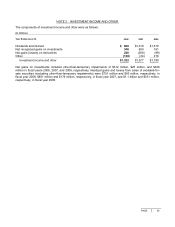
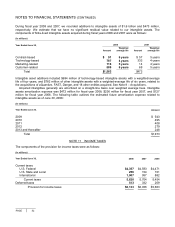
NOTE 3 INVESTMENT INCOME AND OTHER
The components of investment income and other were as follows:
(In millions)
Y
ear Ended June 30, 2008
2007 2006
Dividends and interest $ 888
$1,319 $1,510
Net recognized gains on investments 346
650 161
Net gains (losses) on derivatives 226
(358) (99)
Other (138)
(34) 218
Investment income and other $1,322
$1,577 $1,790
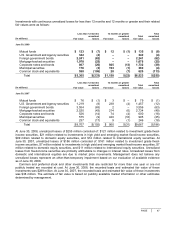
Net gains on investments included other-than-temporary impairments of $312 million, $25 million, and $408
million in fiscal years 2008, 2007, and 2006, respectively. Realized gains and losses from sales of available-for-
sale securities (excluding other-than-temporary impairments) were $751 million and $93 million, respectively, in
fiscal year 2008, $851 million and $176 million, respectively, in fiscal year 2007, and $1.1 billion and $531 million,
respectively, in fiscal year 2006.