Microsoft 2008 Annual Report Download - page 48
Download and view the complete annual report
Please find page 48 of the 2008 Microsoft annual report below. You can navigate through the pages in the report by either clicking on the pages listed below, or by using the keyword search tool below to find specific information within the annual report.-
 1
1 -
2
-
3
-
4
-
5
-
6
-
7
-
8
-
9
-
10
-
11
-
12
-
13
-
14
-
15
-
16
-
17
-
18
-
19
-
20
-
21
-
22
-
23
-
24
-
25
-
26
-
27
-
28
-
29
-
30
-
31
-
32
-
33
-
34
-
35
-
36
-
37
-
 38
38 -
 39
39 -
 40
40 -
 41
41 -
 42
42 -
 43
43 -
 44
44 -
 45
45 -
 46
46 -
 47
47 -
 48
48 -
 49
49 -
 50
50 -
 51
51 -
 52
52 -
 53
53 -
 54
54 -
 55
55 -
 56
56 -
 57
57 -
 58
58 -
59
-
60
-
61
-
62
-
63
-
64
-
65
-
66
-
67
-
68
-
69
-
70
-
71
-
72
-
73
 |
 |

PAGE 47
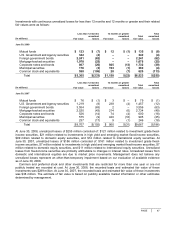
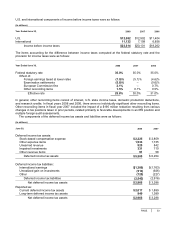
Investments with continuous unrealized losses for less than 12 months and 12 months or greater and their related
fair values were as follows:
Less than 12 months 12 months or greater
Total
(In millions) Fair value
unrealized
losses Fair value
unrealized
losses
Total
fair value
unrealized
losses
June 30, 2008
Mutual funds $123
$
(7) $12 $(1)
$ 135
$
(8)
U.S. Government and Agency securities 342 (4) – –
342 (4)
Foreign government bonds 2,241 (62) – –
2,241 (62)
Mortgage-backed securities 1,078 (25) – –
1,078 (25)
Corporate notes and bonds 807 (26) 925 (13)
1,732 (39)
Municipal securities 176 (3) 193 (1)
369 (4)
Common stock and equivalents 598 (106) 28 (7)
626 (113)
Total $5,365
$
(233) $1,158 $(22)
$6,523
$
(255)
Less than 12 months 12 months or greater
Total
(In millions) Fair value
unrealized
losses Fair value
unrealized
losses
Total
fair value
unrealized
losses
June 30, 2007
Mutual funds $76
$
(1) $ 3 $–
$
79
$
(1)
U.S. Government and Agency securities 1,219 (8) 238 (4)
1,457 (12)
Foreign government bonds 3,554 (63) 2 –
3,556 (63)
Mortgage-backed securities 2,520 (43) 214 (6)
2,734 (49)
Corporate notes and bonds 526 (14) 74 (4)
600 (18)
Municipal securities 575 (9) 420 (16)
995 (25)
Common stock and equivalents 237 (17) 9 (1)
246 (18)
Total $8,707
$
(155) $960 $(31)
$
9,667
$
(186)
At June 30, 2008, unrealized losses of $255 million consisted of: $121 million related to investment grade fixed-
income securities, $21 million related to investments in high yield and emerging market fixed-income securities,
$99 million related to domestic equity securities, and $14 million related to international equity securities. At
June 30, 2007, unrealized losses of $186 million consisted of: $161 million related to investment grade fixed-
income securities, $7 million related to investments in high yield and emerging market fixed-income securities, $7
million related to domestic equity securities, and $11 million related to international equity securities. Unrealized
losses from fixed-income securities are primarily attributable to changes in interest rates. Unrealized losses from
domestic and international equities are due to market price movements. Management does not believe any
unrealized losses represent an other-than-temporary impairment based on our evaluation of available evidence
as of June 30, 2008.
Common and preferred stock and other investments that are restricted for more than one year or are not
publicly traded are recorded at cost. At June 30, 2008, the recorded basis and estimated fair value of these
investments was $289 million. At June 30, 2007, the recorded basis and estimated fair value of these investments
was $38 million. The estimate of fair value is based on publicly available market information or other estimates
determined by management.