Microsoft 2008 Annual Report Download - page 54
Download and view the complete annual report
Please find page 54 of the 2008 Microsoft annual report below. You can navigate through the pages in the report by either clicking on the pages listed below, or by using the keyword search tool below to find specific information within the annual report.-
 1
1 -
2
-
3
-
4
-
5
-
6
-
7
-
8
-
9
-
10
-
11
-
12
-
13
-
14
-
15
-
16
-
17
-
18
-
19
-
20
-
21
-
22
-
23
-
24
-
25
-
26
-
27
-
28
-
29
-
30
-
31
-
32
-
33
-
34
-
35
-
36
-
37
-
38
-
39
-
40
-
41
-
42
-
43
-
 44
44 -
 45
45 -
 46
46 -
 47
47 -
 48
48 -
 49
49 -
 50
50 -
 51
51 -
 52
52 -
 53
53 -
 54
54 -
 55
55 -
 56
56 -
 57
57 -
 58
58 -
 59
59 -
 60
60 -
 61
61 -
 62
62 -
 63
63 -
 64
64 -
65
-
66
-
67
-
68
-
69
-
70
-
71
-
72
-
73
 |
 |

PAGE 53
U.S. and international components of income before income taxes were as follows:
(In millions)
Y
ear Ended June 30, 2008
2007 2006
U.S. $12,682 $12,902 $
1
1,404
International 11,132 7,199 6,858
Income before income taxes $23,814 $
2
0,101 $
1
8,262
The items accounting for the difference between income taxes computed at the federal statutory rate and the
provision for income taxes were as follows:
Y
ear Ended June 30, 2008 2007
2006
Federal statutory rate 35.0% 35.0% 35.0%
Effect of:
Foreign earnings taxed at lower rates (7.0)% (5.1)% (4.6)%
Examination settlements (5.8)%
–
(0.6)%
European Commission fine 2.1%
–
0.7%
Other reconciling items 1.5% 0.1% 0.5%
Effective rate 25.8% 30.0% 31.0%
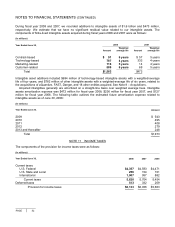
In general, other reconciling items consist of interest, U.S. state income taxes, domestic production deductions,
and research credits. In fiscal years 2008 and 2006, there were no individually significant other reconciling items.
Other reconciling items in fiscal year 2007 included the impact of a $195 million reduction resulting from various
changes in tax positions taken in prior periods, related primarily to favorable developments in an IRS position and
multiple foreign audit assessments.
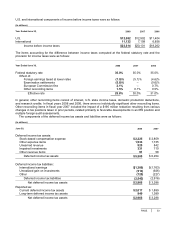
The components of the deferred income tax assets and liabilities were as follows:
(In millions)
June 30, 2008 2007
Deferred income tax assets:
Stock-based compensation expense $ 2,225 $ 2,859
Other expense items 1,933 1,735
Unearned revenue 928 842
Impaired investments 331 710
Other revenue items 91 58
Deferred income tax assets $ 5,508 $ 6,204
Deferred income tax liabilities:
International earnings $
(
1,300) $
(
1,763)
Unrealized gain on investments (513) (926)
Other (729) (227)
Deferred income tax liabilities (2,542)
(
2,916)
Net deferred income tax assets $ 2,966 $3,288
Reported as:
Current deferred income tax assets $ 2,017 $1,899
Long-term deferred income tax assets 949 1,389
Net deferred income tax assets $ 2,966 $3,288